The Great Debate: Choosing Between S&P 500 and Total Stock Market Index Funds
For over three decades, investors have grappled with a seemingly complex dilemma: should their portfolios be anchored by the S&P 500 or a Total Stock Market index? This debate—frequently distilled into the rivalry between Vanguard’s VOO and VTI, or their mutual fund counterparts, VFIAX and VTSAX—often creates unnecessary anxiety for retail investors.
The reality is that while the technical structures of these funds differ, their historical performance, risk profiles, and ultimate utility in a diversified portfolio are remarkably similar. To resolve this, we must strip away the marketing noise and look at the structural mechanics of how these two investment vehicles actually operate.
Main Facts: The Structural Reality
At their core, both the S&P 500 and Total Stock Market indexes are passive, low-cost, market-cap-weighted investment vehicles. Vanguard, for instance, offers both VOO (S&P 500) and VTI (Total Stock Market) at a remarkably low expense ratio of 0.03%. Because they are structured as Exchange Traded Funds (ETFs), they offer liquidity, no minimum purchase requirements, and are managed by institutions overseeing trillions in assets.
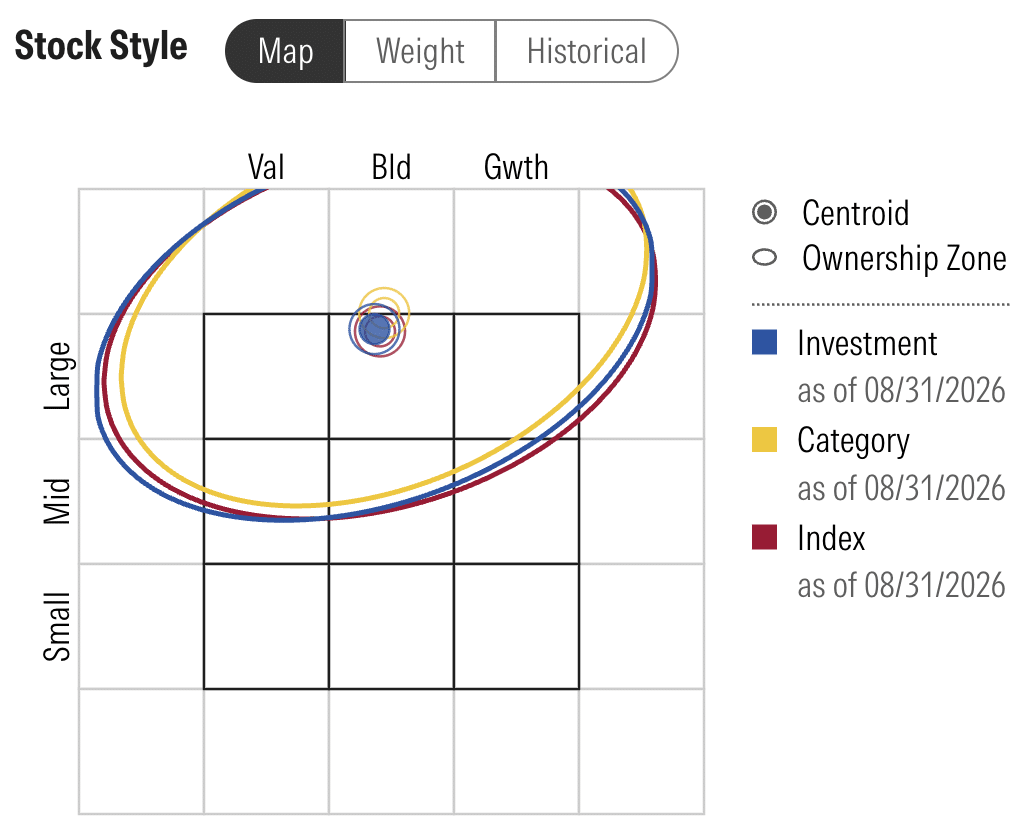
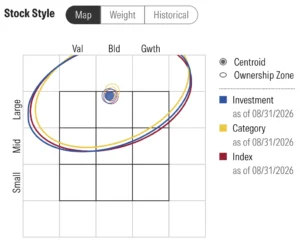
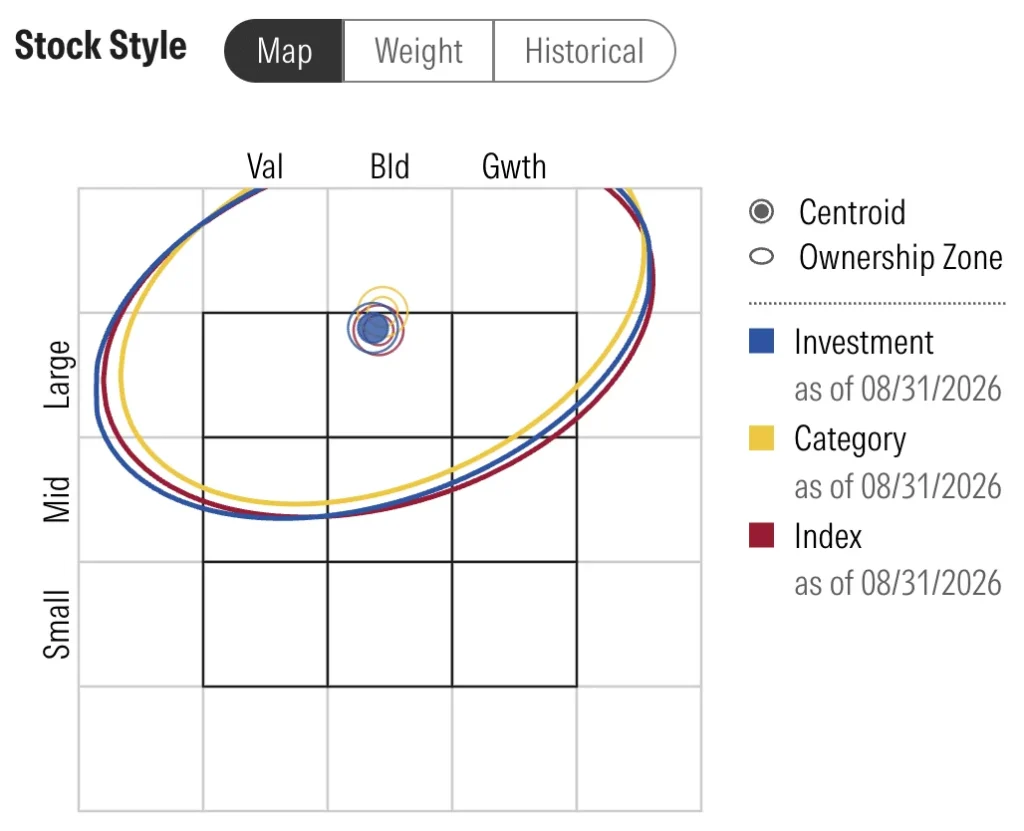
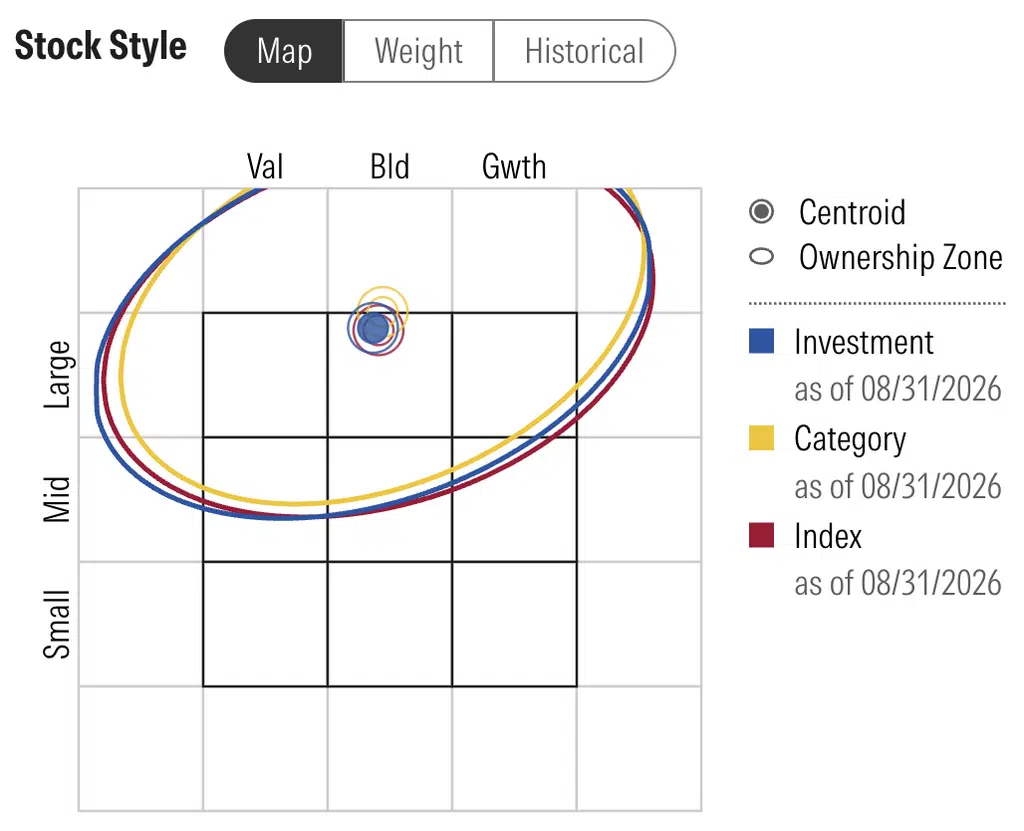
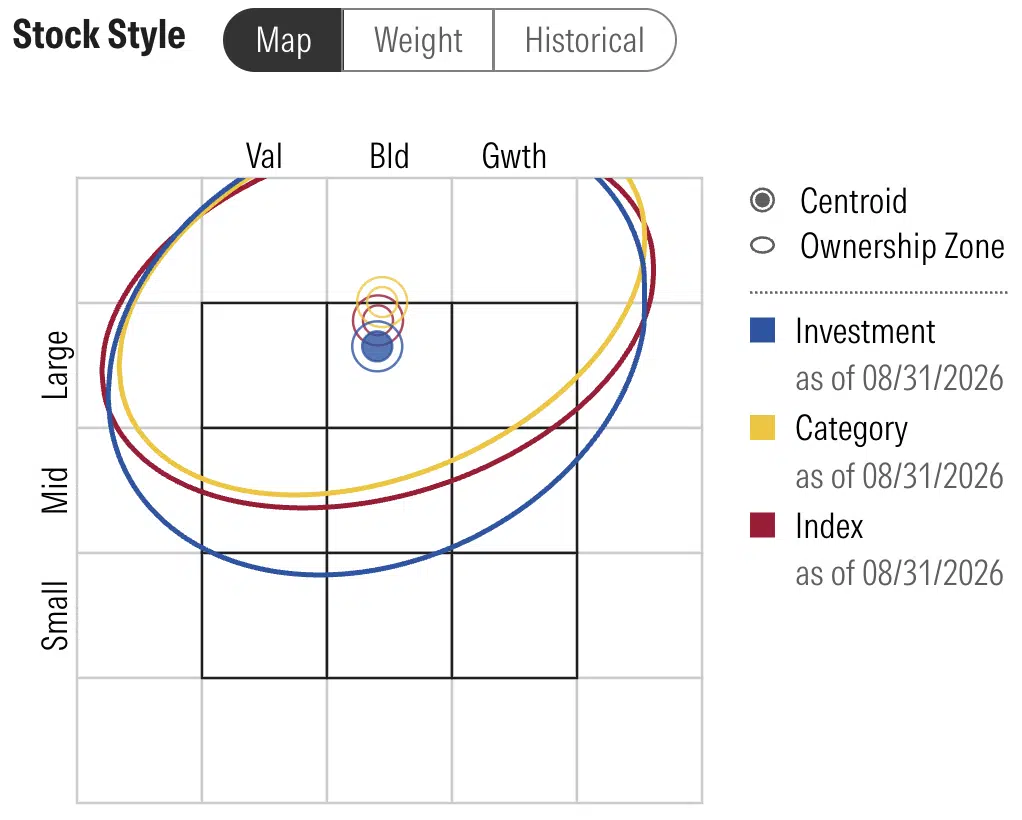
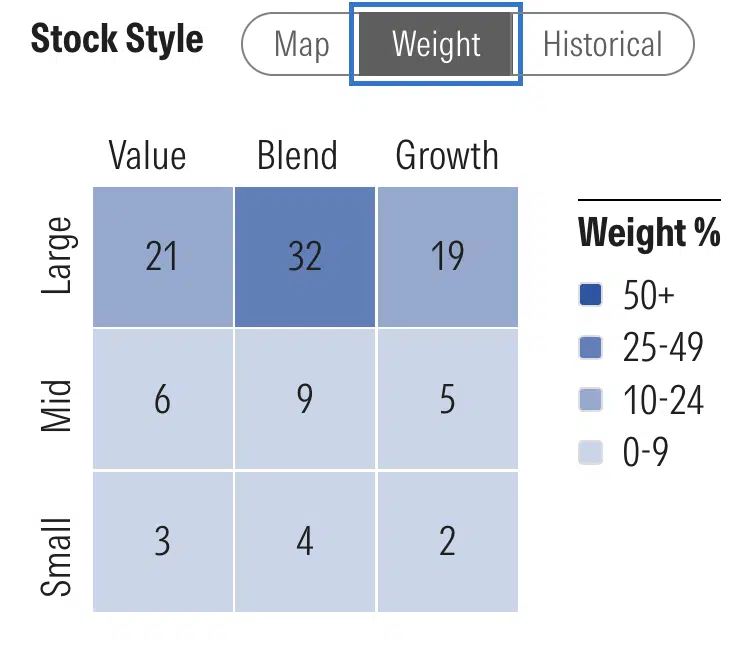
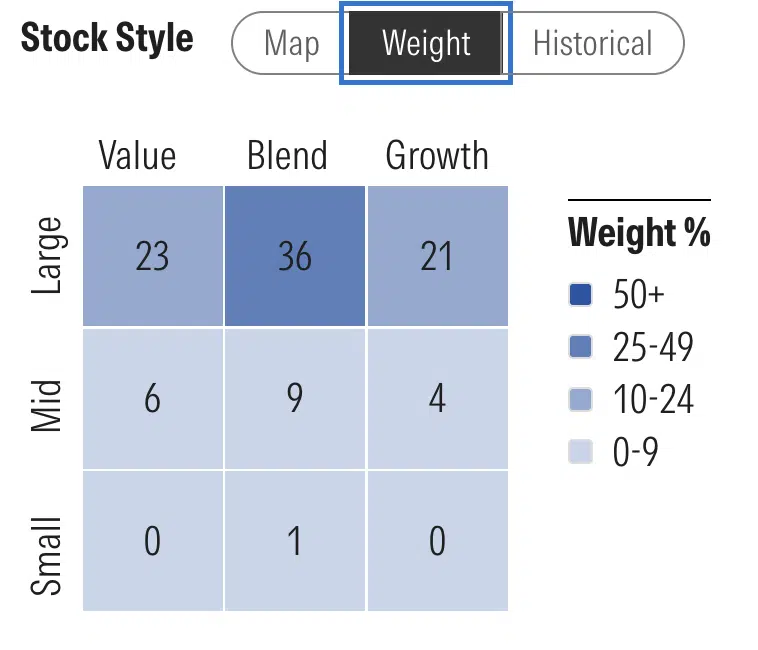
The fundamental distinction lies in their breadth. The S&P 500 tracks 500 of the largest, most established U.S. companies. The Total Stock Market index, by contrast, acts as a catch-all, capturing virtually every publicly traded company in the United States—roughly 3,500 holdings in total.
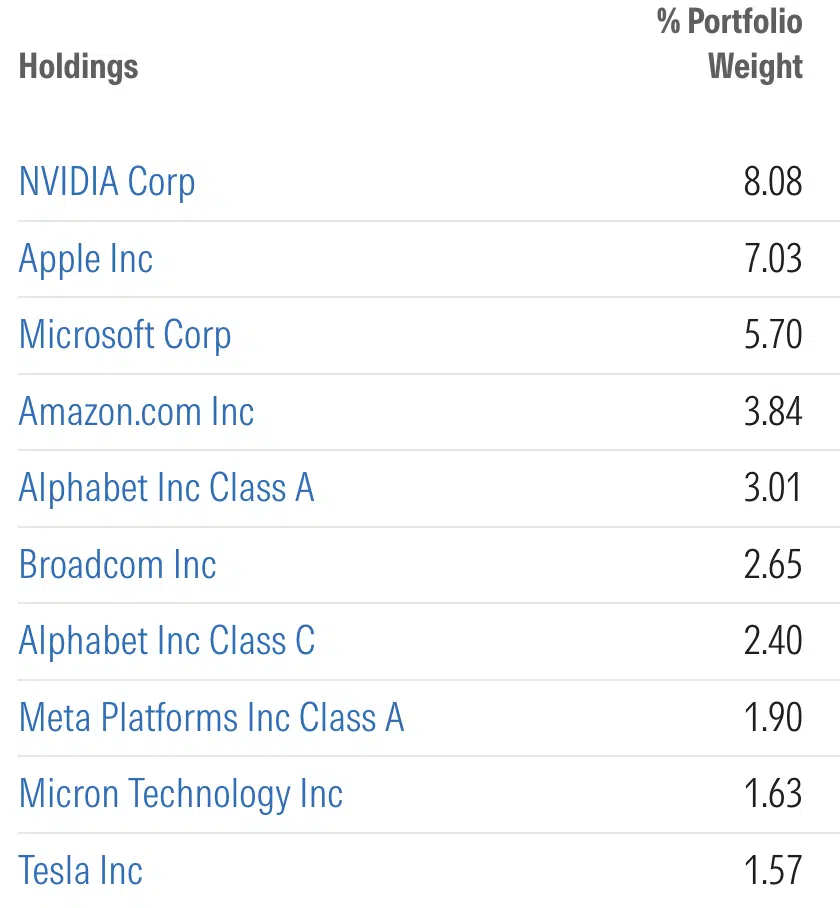
Despite this difference in quantity, the "large-cap" bias is the defining characteristic of both. Because they are market-capitalization-weighted, the largest companies—like NVIDIA, Microsoft, and Apple—dominate both funds. When the largest companies in the S&P 500 have a banner year, both funds tend to rise in tandem.
Chronology: The Evolution of Indexing
The rise of index investing is a relatively modern phenomenon in the context of market history. In the early 1970s, the concept of a low-cost, broad-market index fund was considered radical—even "un-American," according to some critics at the time.
- The 1970s and 80s: This era established the dominance of the S&P 500 as the primary benchmark for the U.S. economy. Investors grew accustomed to measuring their performance against these 500 companies.
- The 1990s and 2000s: As computing power increased, the ability to track thousands of smaller companies became cheaper and more efficient. The "Total Stock Market" index began to gain traction as a more holistic way to own the entire U.S. equity market, rather than just the top 500 companies.
- The Current Era: We now exist in an environment where the distinction is largely academic. With high-frequency trading and efficient market hypothesis dominating, the gap between a 500-stock portfolio and a 3,500-stock portfolio has narrowed to a negligible margin in terms of long-term wealth accumulation.
Supporting Data: The Case for Similarity
When evaluating the performance of these two asset classes over long horizons—using data dating back to 1972—the results are striking in their similarity.
Performance Metrics
If you compare the Compound Annual Growth Rate (CAGR) of an S&P 500-based portfolio against a Total Stock Market portfolio, the difference is often measured in mere basis points (hundredths of a percent). In some periods, the Total Stock Market slightly outperforms due to the historical outperformance of "small-cap" stocks (the Fama-French small-cap premium). In other decades, the S&P 500 dominates because of its heavy concentration in high-growth, large-cap technology stocks.
Volatility and Risk
Volatility, measured by standard deviation, shows that both funds behave almost identically during market corrections. When the market experiences a drawdown, both funds drop. When the market recovers, both rise. This is because, in both funds, the top 10 holdings represent a significant percentage of the total assets. For example, if NVIDIA, Microsoft, and Apple undergo a correction, the impact is felt almost equally by both the S&P 500 and the Total Stock Market index.
Official Perspectives and Market Theory
Financial theorists and institutional fund managers generally agree on one point: the choice between these two is less about "winning" and more about "preference."
The primary argument for the Total Stock Market (VTI) is philosophical: it is the "purest" way to own the U.S. market. By owning everything, you eliminate the risk of missing out on a mid-cap company that might eventually become the next industry giant.
The primary argument for the S&P 500 (VOO) is institutional stability: these 500 companies are heavily vetted, generally profitable, and command global economic influence. For many investors, the S&P 500 is simply easier to track and understand, as it aligns with the daily news cycle and major financial reporting.
Implications for Your Portfolio
Choosing between these two is not a binary "right vs. wrong" decision. Instead, it should be viewed through the lens of your specific investment goals and portfolio structure.
1. The "Keep It Simple" Approach
If your goal is to hold a "Three-Fund Portfolio"—which typically includes a total U.S. stock fund, an international stock fund, and a bond fund—the Total Stock Market index is arguably the cleaner choice. It captures the entire domestic market in one ticker, allowing you to rebalance your asset allocation with ease.
2. The "Slicing and Dicing" Approach
If you are a more active, analytical investor who prefers to overweight certain sectors—perhaps by adding separate small-cap value or mid-cap funds—using the S&P 500 as your "core" allows for more surgical precision. You can build your portfolio using the S&P 500 as the foundation, then add specific slices of the market to reach your desired risk profile.
3. The 401(k) Constraint
For many, the decision is made for them by their employer. If your 401(k) plan offers an S&P 500 fund but lacks a Total Stock Market option, take the S&P 500 fund without hesitation. The difference in long-term performance is statistically insignificant compared to the impact of your savings rate and your asset allocation between stocks and bonds.
Monitoring Your Progress
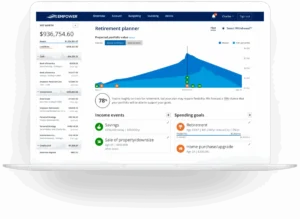
Regardless of which vehicle you choose, the most important factor in your success is not the specific ticker symbol, but your overall asset allocation. Using a consolidated dashboard—such as those offered by Empower—allows you to see your entire net worth, including fees, asset allocation across all accounts, and projected retirement income.
Seeing your total exposure to U.S. equities in one place removes the confusion of holding multiple funds across different accounts. It provides a "bird’s-eye view" that helps you stay the course, even when market volatility tests your resolve.
Final Thoughts
The "VOO vs. VTI" debate is a classic example of an investor focusing on the wrong variables. Whether you choose the S&P 500 or the Total Stock Market, you are making a fundamentally sound decision to capture the growth of the American economy at a near-zero cost.
Both funds are excellent. Both provide the necessary exposure to the world’s most robust equity market. Both have helped millions of investors reach their financial independence goals. Stop agonizing over the minor differences in holdings and percentages. Instead, focus on what actually drives your wealth: the amount you invest, the consistency of your contributions, and your ability to maintain a long-term perspective during market cycles. Your future self will thank you for the simplicity, not the complexity, of your portfolio.