In the ever-shifting landscape of global finance, market observers and retail investors alike are grappling with a bizarre paradox: unprecedented macroeconomic and technological optimism running parallel to extreme structural concentration risks. According to recent commentary from financial commentators and market analysts, the modern equity market is being pushed into uncharted territory by a tiny fraction of corporate giants.
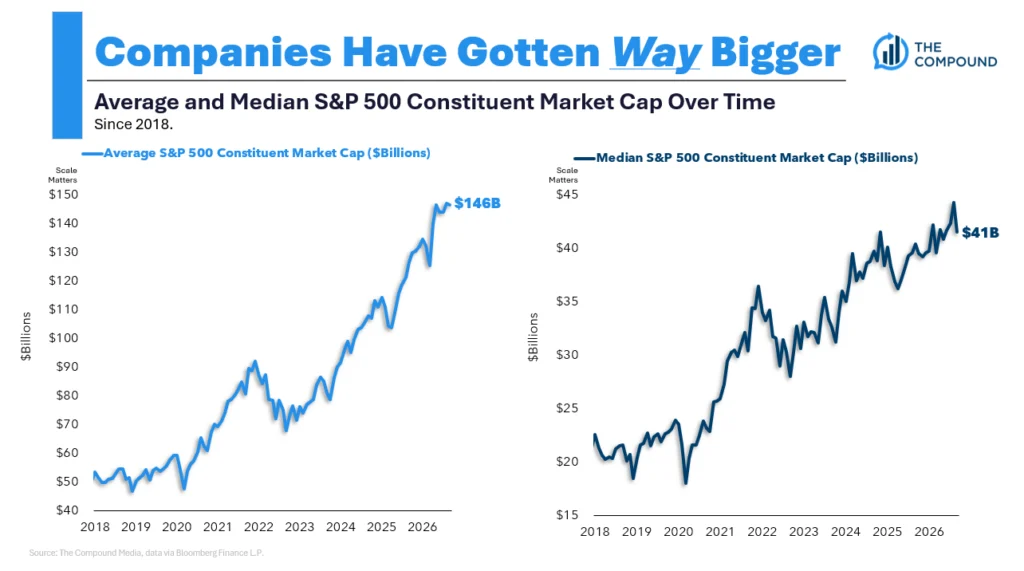
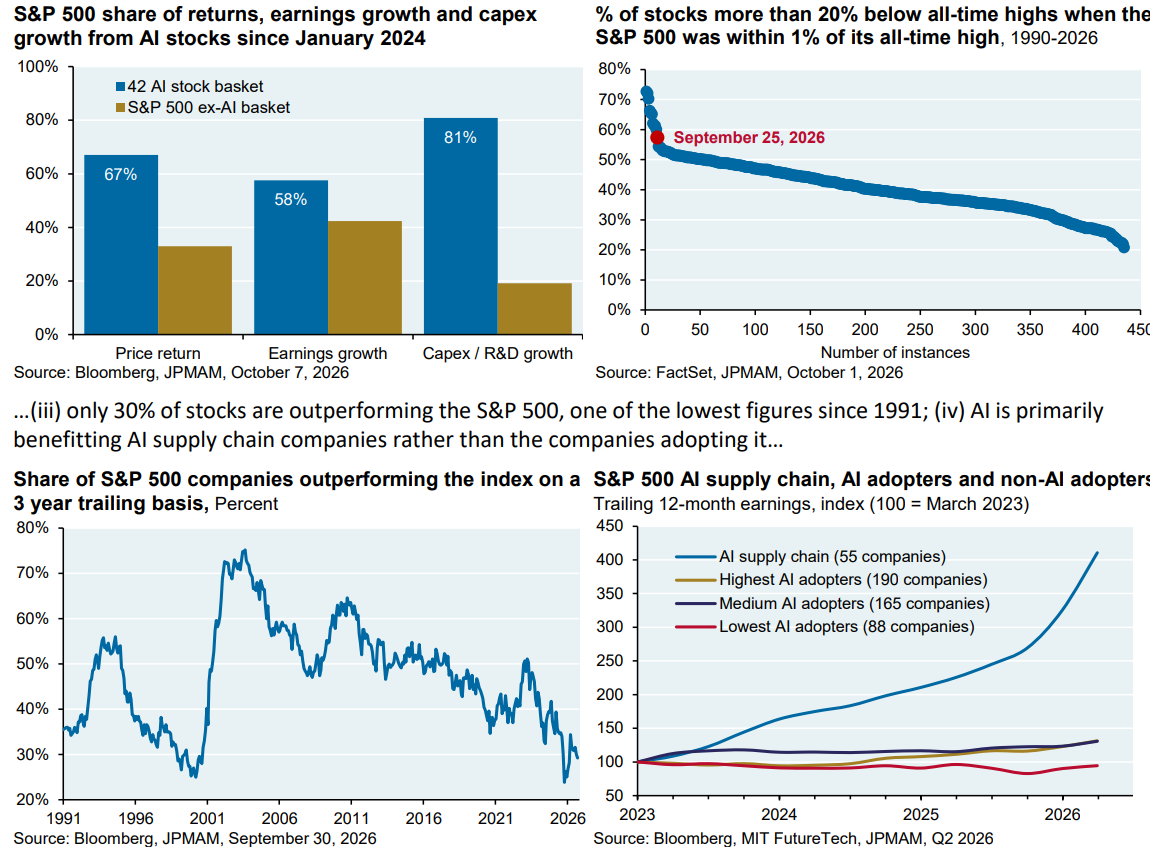
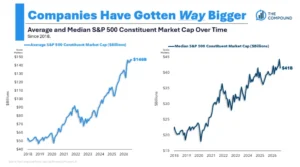
At the center of today’s discourse is the S&P 500, an index that has historically served as a reliable barometer for American corporate health. However, recent data highlights a staggering reality: market concentration has reached levels never before experienced in financial history. As Michael Batnick pointed out on social media platform X (formerly Twitter), the combined market capitalization of just the top five stocks in the S&P 500 now equals the bottom 434 stocks in the index combined. This hyper-concentration is warping traditional breadth indicators, creating a facade of widespread market participation while the engine of growth remains restricted to a handful of megacap titans.
Simultaneously, corporate giants are making generational, high-stakes wagers on artificial intelligence. Meta’s infamous $100 billion bet on developing a frontier AI model has sparked intense debate over capital allocation, corporate governance, and the very real threat of catastrophic financial fallout if the technology fails to commercialize rapidly. Meanwhile, macro-level trends—such as the persistent divergence between China’s explosive real-economy growth and the superior performance of U.S. financial assets—continue to confound traditional economic logic.
Chronology of Recent Market Developments
To understand how financial markets arrived at this juncture in mid-October 2026, it is necessary to trace the timeline of key disclosures, executive warnings, and data releases that have shaped investor sentiment over the past week:
October 8, 2026: Market analysts sound the alarm regarding equity concentration. Michael Batnick releases data illustrating that the top 5 stocks in the S&P 500 equal the bottom 434 companies. Concurrently, economist Jason Furman highlights mounting concerns over fiscal policy and structural "crowd-out" effects in the broader economy.
October 9, 2026: Economic commentators focus on the stark divergence between national economic output and financial returns. Egan Jones releases data highlighting that while the Chinese economy has outgrown the United States across virtually every fundamental metric since 2004, American financial assets have vastly outperformed their Chinese counterparts over the same timeframe.
October 12, 2026: High-stakes corporate strategy takes center stage as public commentary highlights discussions between Meta CEO Mark Zuckerberg and Scale AI CEO Alexandr Wang regarding Meta’s aggressive $100 billion AI infrastructure pivot. The conversation brings corporate risk tolerance into sharp relief.
October 14, 2026: Industry experts and podcasters aggregate these disparate threads—spanning equity market structure, macroeconomic shifts, and technological capital expenditures—into a comprehensive review of current investor sentiment and market positioning.
Supporting Data and Market Metrics
The financial charts and quantitative data circulating among analysts this week paint a complex picture of modern capital markets. The fundamental tension lies between macroeconomic expansion and asset pricing dynamics.
The S&P 500 Concentration Gap
Market breadth indicators have historically been used by technical analysts to gauge the health of a bull market. When breadth is strong, hundreds of stocks participate in upward momentum. However, as Batnick’s analysis demonstrates, the sheer weight of the top five constituents—spanning dominant tech and growth sectors—distorts these metrics. Because these firms command trillions of dollars in market capitalization, their daily price movements dictate the trajectory of cap-weighted indexes entirely on their own, masking underlying weakness or stagnation in hundreds of mid- and small-cap companies.
The U.S. vs. China Asset Divergence
A chart from Egan Jones circulating via financial analysts Joe Weisenthal and others underscores a profound disconnect in global finance:
The Real Economy: Since 2004, China’s Gross Domestic Product (GDP) and industrial output have expanded at a rate that outpaces the United States by nearly every traditional metric.
The Financial Assets: Despite China’s superior economic growth metrics, U.S. financial assets—equities, corporate bonds, and alternative investments—have systematically "clobbered" Chinese equities over the same two-decade period.
This divergence highlights the critical distinction between macroeconomic growth (GDP expansion) and shareholder value creation (corporate governance, profitability, return on equity, and shareholder-friendly capital allocation policies). While capital has flowed aggressively into Western markets due to perceived regulatory stability and liquidity, Chinese markets have struggled to translate macro growth into sustained equity returns for public investors.
Official Responses and Corporate Commentary
As corporate spending on artificial intelligence reaches unprecedented heights, executive leadership is being forced to publicly address the existential risks associated with these investments.
The conversation surrounding Meta’s $100 billion expenditure on frontier artificial intelligence models brought raw corporate candor into the public eye. During discussions featuring Mark Zuckerberg and Alexandr Wang, Meta Chief Financial Officer Susan Li offered a remarkably blunt assessment of the stakes involved:
"I just want to tell you if this doesn’t work, this is going to be really, really bad. It’s going to be very, very bad in financial terms… It’s like, it has to…"
This rare admission from a sitting CFO highlights the high-wire act currently being performed by Silicon Valley’s mega-cap firms. To maintain competitive supremacy, these companies are committing sums equivalent to the GDP of small nations into speculative AI research and infrastructure. If these frontier models successfully unlock new paradigms of productivity and monetization—as early adopters claim they are already seeing in niche business applications—the investment will be justified. However, if artificial intelligence hits a technical ceiling or fails to yield sufficient return on invested capital (ROIC), the resulting capital destruction will reverberate across the broader technology sector and trickled down into diversified index funds held by millions of retail investors.
On the macroeconomic front, public policy experts like Jason Furman have drawn attention to fiscal dynamics, noting the emergence of structural "crowd-out" effects. As government expenditures and debt issuance remain elevated, private sector borrowers face stiffer competition for capital, altering borrowing costs and investment flows throughout the economy.
Implications for Investors and the Broader Economy
The confluence of hyper-concentrated equity indexes, multi-billion-dollar corporate gambles on AI, and global economic divergences carries profound implications for asset allocators, institutional managers, and everyday savers:
Illusion of Diversification: Investors who believe they are well-diversified by purchasing a standard cap-weighted S&P 500 index fund must recognize that their portfolio is heavily tethered to the performance of a tiny oligopoly of technology giants. A downturn in these top holdings can drag down an entire portfolio, regardless of how the other hundreds of constituent companies perform.
The High Stakes of Technological Transition: The corporate willingness to risk multi-billion-dollar losses on artificial intelligence points to a winner-take-all mentality. Companies that successfully integrate AI to drive top-line revenue—such as the early adopters reporting hundreds of thousands of dollars in new revenue over short windows—will widen their competitive moat. Conversely, laggards risk obsolescence.
Global Portfolio Construction: The ongoing divergence between U.S. asset performance and international growth serves as a reminder that a country’s economic growth rate does not automatically dictate its stock market returns. Institutional frameworks, shareholder protections, and liquidity remain paramount drivers of long-term investment success.
As markets navigate these structural shifts, financial professionals continue to emphasize that understanding these underlying currents is essential for weathering potential volatility ahead.
Disclaimer: Nothing in this article constitutes investment advice, performance data, or any recommendation that any particular security, portfolio of securities, transaction, or investment strategy is suitable for any specific person. Investing in speculative securities involves the risk of loss.