Navigating the Era of Hyper-Concentration: How to Hedge the "One Big AI Trade" Without Timing the Market
Main Facts
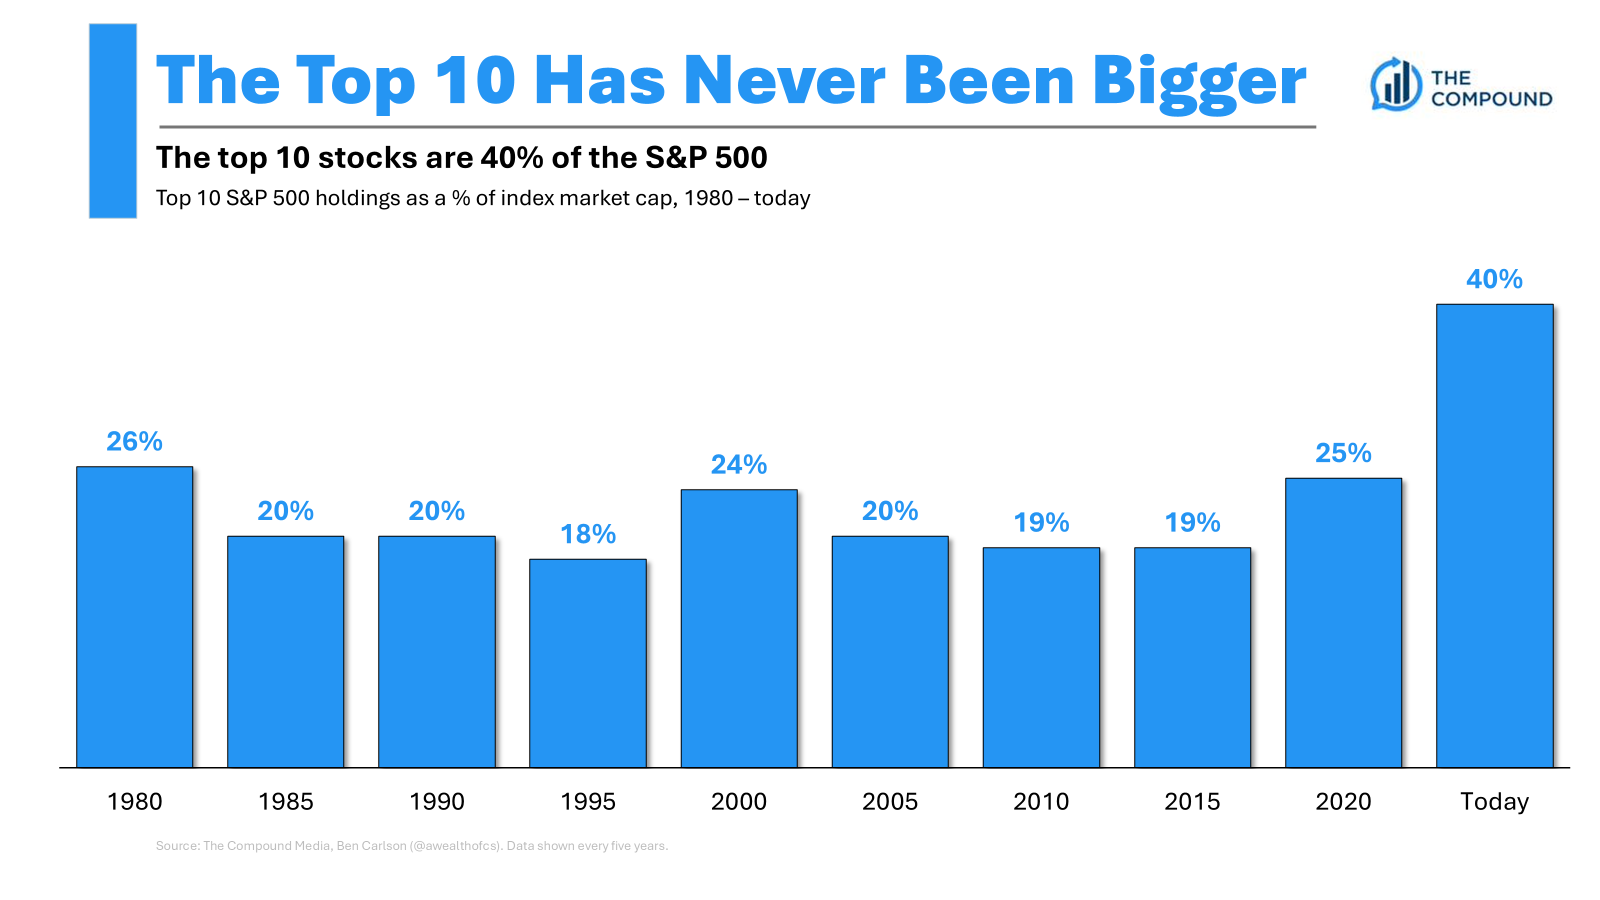
Stock market concentration has surged to historic highs, dominated by a single macroeconomic narrative: Artificial Intelligence (AI). For the better part of a decade, investors have watched the S&P 500 narrow its breadth as mega-cap technology companies expand their footprint. Today, the top 10 stocks account for roughly 40% of the entire S&P 500 index—a level of concentration not witnessed since the 1950s and 1960s.
To put this dominance into perspective, the top 5 largest corporations in the U.S. stock market now carry a combined market capitalization equal to the bottom 434 stocks in the index combined. Every single member of the current top 10 club boasts a market valuation scaled in "four commas"—surpassing the trillion-dollar threshold individually, and collectively worth over $28 trillion.
While retail and institutional investors alike grapple with the existential dread of the "One Big Trade," financial planners are being flooded with a singular question: How does an investor effectively hedge against AI concentration risk without resorting to market-timing, cashing out into low-yield instruments, or missing out on ongoing tech momentum?
The dilemma is twofold. On one hand, capital expenditures (capex) dedicated to AI infrastructure are funneling immense profits straight into the mega-caps, meaning their 40% share of market cap is mirrored by a matching 40% share of corporate profits. On the other hand, the specter of a sudden correction or a burst AI bubble leaves portfolios dangerously exposed to a sharp, asymmetric drawdown.
Chronology: The Evolution of Market Dominance
To understand how modern equity markets arrived at this juncture, it is helpful to trace the timeline of index concentration over the past half-century:
- The 1980s through 2010s (The Baseline Era): For decades, the top 10 holdings of the S&P 500 maintained a relatively stable grip on the index, consistently hovering between 20% and 25% of the total market capitalization. Even during the dot-com boom of the late 1990s, market leadership, while tech-heavy, was slightly more fractured across telecom, networking, and software startups.
- 2018 (Early Warnings): Market analysts and commentators began formally sounding alarms regarding creeping index concentration. At this point, passive index funds were quietly funneling a disproportionate amount of every new dollar into a rapidly solidifying group of platform giants.
- The 2020s Pandemic and Post-Pandemic Boom: Concentration accelerated aggressively this decade. The normalization of remote work, cloud computing dominance, and sweeping digitalization cemented the supremacy of a handful of firms.
- 2023–2024 (The Generative AI Explosion): The public rollout of advanced generative AI models triggered an unprecedented capex race. Silicon Valley heavyweights poured hundreds of billions of dollars into specialized chips, data centers, and energy infrastructure, transforming the mega-caps into a monolithic "AI Trade."
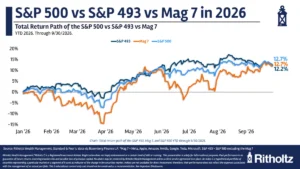
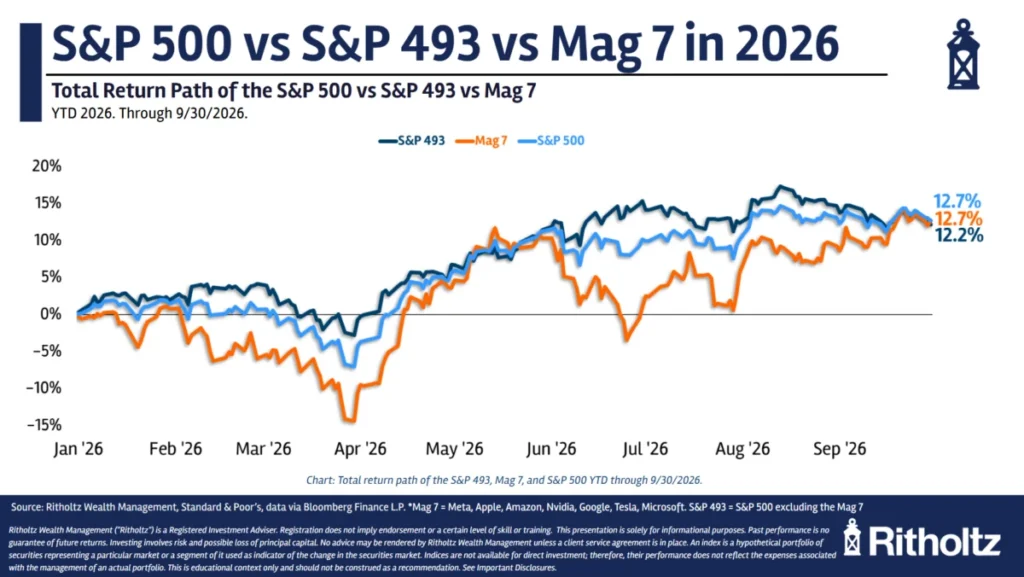
- 2024–2025 (The Breadth Tug-of-War): The market experienced periods of rotational turbulence. For extended stretches, the "Magnificent 7" took a backseat as the remaining 493 stocks in the S&P 500 drove index gains—sparking brief celebrations of healthy market breadth. However, mega-tech swiftly reclaimed its crown, leaving year-to-date performance charts nearly neck-and-neck between the index giants and the broader market, albeit with significantly higher volatility for the tech leaders.
Supporting Data: The Metrics of Mega-Cap Supremacy
Data visualization from market historians highlights just how extreme modern equity concentration has become.
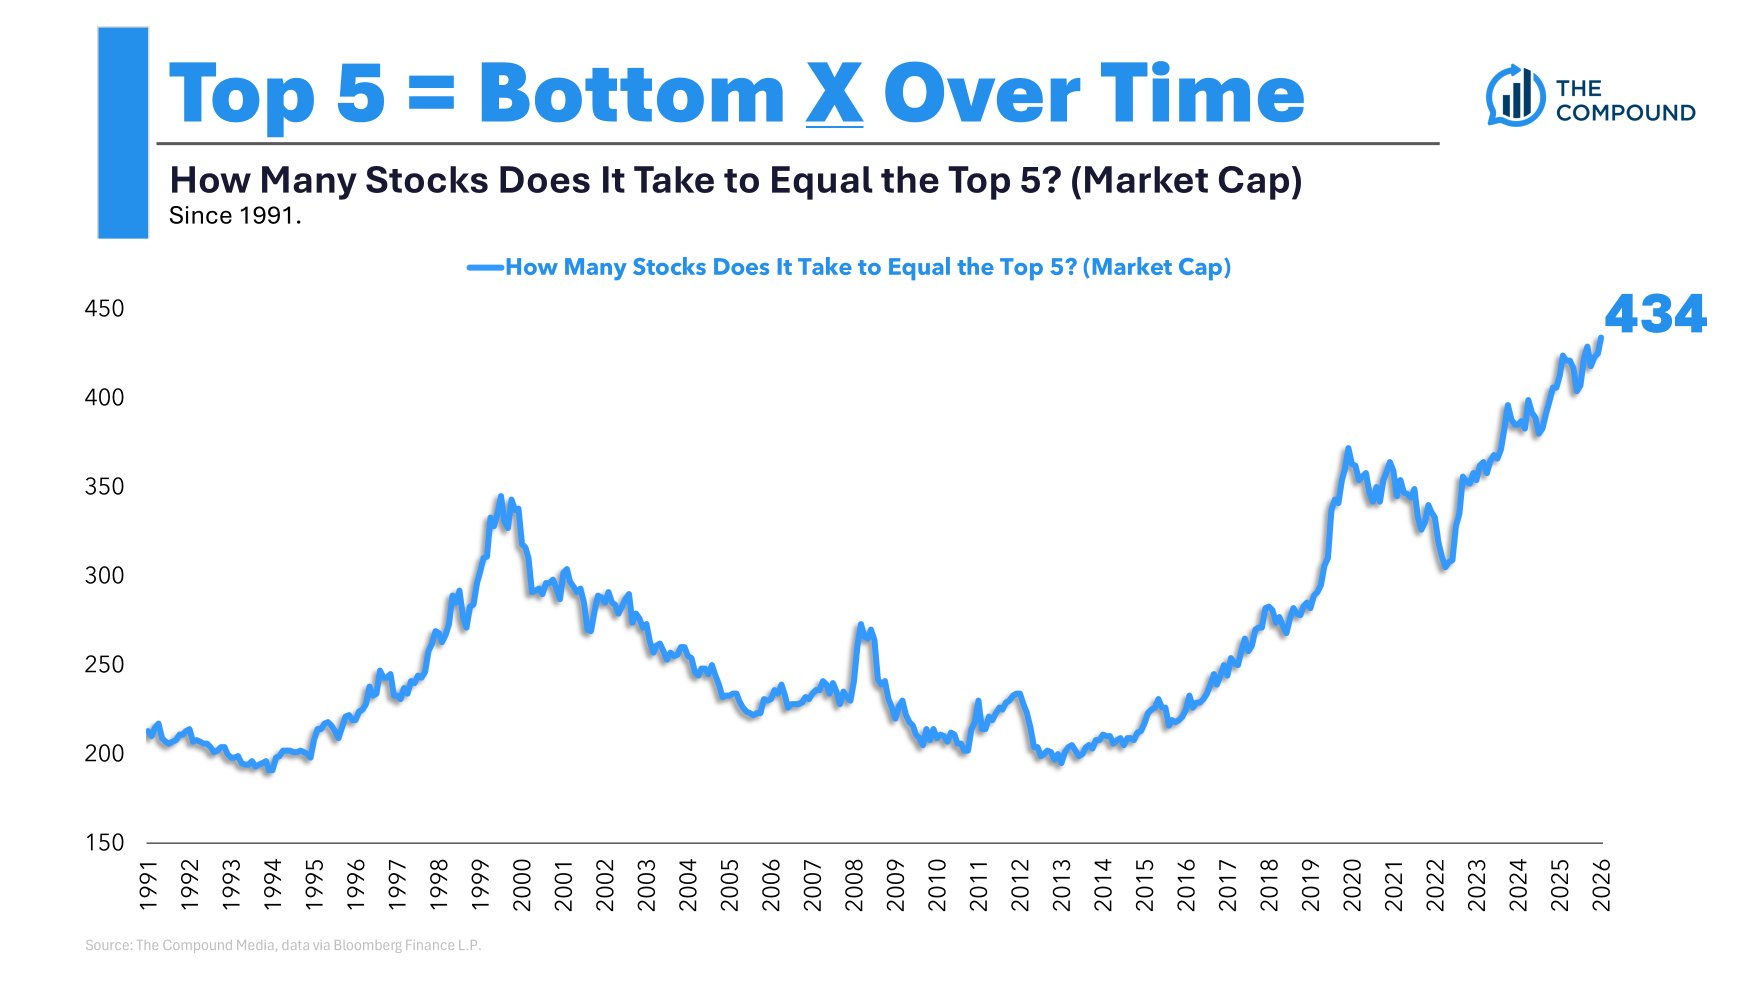
- The Scale Shift: Ten years ago, the five largest corporations were worth roughly the equivalent of the bottom 225 stocks in the S&P 500. Today, that top 5 cohort matches the bottom 434 stocks in sheer economic weight.
- The S&P 500 vs. Nasdaq 100 Risk Profile: While the S&P 500 sees 40% of its weight concentrated in its top 10 holdings, the Nasdaq 100 takes concentration to an even steeper extreme, with its top 10 holdings accounting for nearly 50% of the entire index.
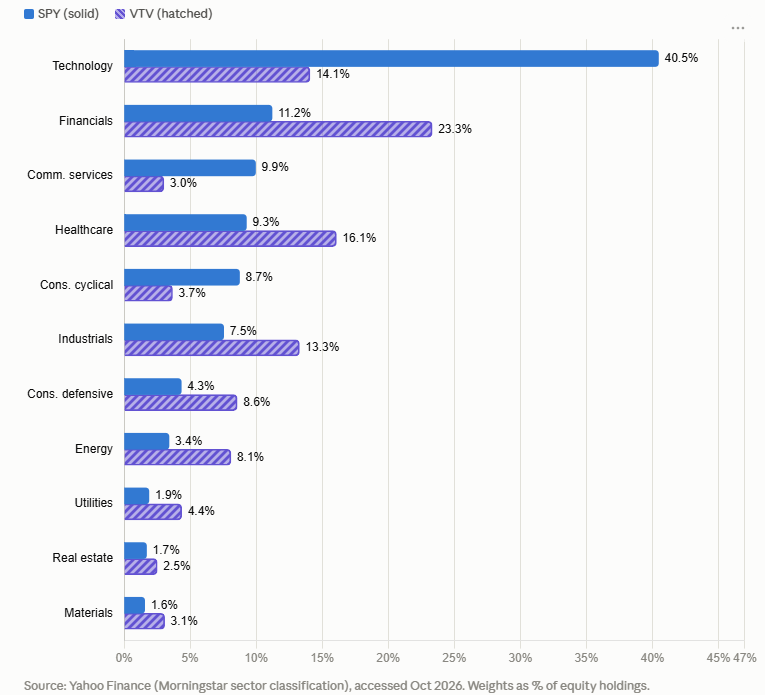
- Alternative Sector Weightings: When comparing market-cap-weighted indices to fundamentally driven or alternative factor strategies, the structural divergence becomes stark. For instance:
- Vanguard Europe ETF: Features a dramatically different sector breakdown compared to the S&P 500, with negligible exposure to U.S.-style mega-cap tech and a heavier reliance on financials, industrials, and healthcare.
- S&P Dividend and Value ETFs: Skew heavily toward cash-flow-positive, slower-growing, mature industries. Their top 10 holdings are dominated by industrials, energy firms, and mega-banks rather than semiconductor designers and cloud providers.
- The 2024 Breadth Illusion: Year-to-date performance metrics reveal a nuanced reality. While the Magnificent 7 provided a volatile, rollercoaster ride, and the "S&P 493" provided steady, unassuming growth, both groups ultimately converged near identical performance lines by the end of the third quarter. This suggests that owning the broader index captured the ultimate destination, regardless of whether the vehicle was driven by the tech elite or the broader economic engine.
Official Perspectives and Market Responses
Financial advisors, portfolio managers, and regulatory bodies have adopted varied stances on the phenomenon of market concentration.
From a regulatory standpoint, federal antitrust watchdogs have scrutinized big tech companies for monopolistic practices. However, government intervention has failed to dismantle or meaningfully fracture these conglomerates. Why? Because consumer demand remains insatiable. Millions of individuals and businesses worldwide rely daily on the hardware, software, cloud storage, and AI integrations provided by these exact firms.
Institutional wealth managers point out a fundamental justification for the mega-caps’ outsized valuations: earnings. Unlike the dot-com era—when many high-flying tech stocks traded at astronomical multiples with zero revenue or underlying profits—today’s top 10 index titans generate jaw-dropping, tangible free cash flow. Their 40% market cap share is backed directly by a 40% share of corporate earnings.
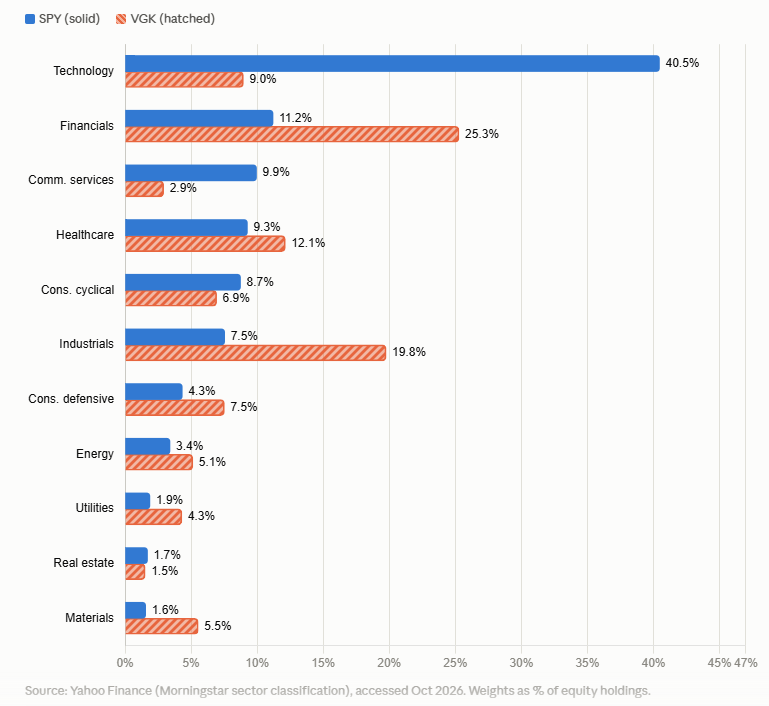
Nevertheless, wealth strategists emphasize that ignoring concentration risk entirely is a gamble. The consensus advice from fiduciary advisors is clear: diversification remains the only rational, mathematically sound solution for investors anxious about overexposure to a single thematic trade.
Rather than engaging in market-timing—such as liquidating portfolios into cash or Treasury bills yielding 4%—advisors recommend tactical asset allocation adjustments. Moving away from pure market-cap weighting allows investors to retain exposure to equities while mitigating systemic blowback if the AI infrastructure thesis fails to yield immediate commercial returns.
Implications: What Happens If the AI Trade Fails?
Speculating on the unwinding of the "One Big Trade" requires looking back at historical precedent, most notably the aftermath of the 2000–2010 "Lost Decade." During that era of repeated market crashes, the extreme concentration of the late-90s bull market evaporated, paving the way for mean reversion where left-behind asset classes finally came back into vogue.
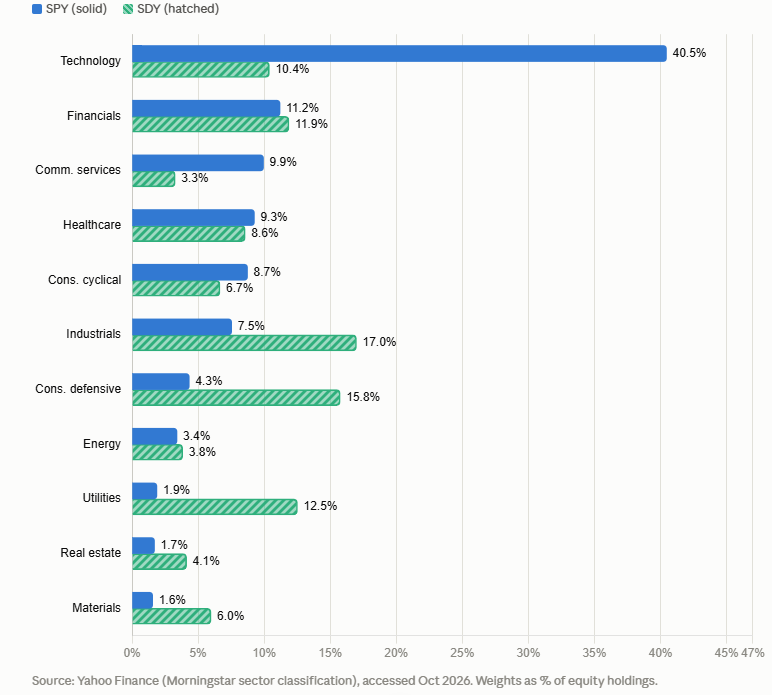
If the AI capex cycle experiences a sudden contraction or if market sentiment shifts violently against mega-cap tech, several structural implications are likely to unfold across global markets:
1. The S&P 500 and Nasdaq 100 Pullback
While a broad market downturn would drag down the standard S&P 500, tech-heavy benchmarks like the Nasdaq 100 would likely experience significantly sharper drawdowns due to their hyper-concentrated top-heavy nature.
2. The Renaissance of Fixed Income
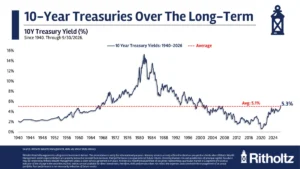
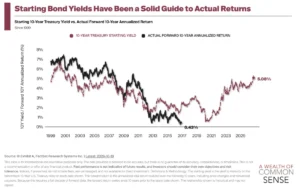
Should AI infrastructure spending slow, economic cooling would likely force central banks to pivot, lowering interest rates. In this scenario, bonds would finally "earn their keep," providing both attractive starting yields and capital appreciation as bond prices rise in a falling-rate environment. Interest-rate-sensitive strategies and fixed-income portfolios would emerge as primary shock absorbers.
3. Outperformance of Foreign and European Equities
International developed markets—particularly Europe—feature much lower allocations to hyper-growth technology stocks. Because the vast majority of AI capital expenditure originates in the United States, foreign markets are largely insulated from localized tech overvaluation. Furthermore, a pullback in U.S. tech spending would likely weaken the U.S. dollar, providing a powerful currency tailwind for U.S. investors holding unhedged foreign equities.
4. The Rise of Alternative Factors (Value, Dividends, and Low Volatility)
Investors seeking to step outside market-cap-weighted indices can look to alternative factor strategies. Value stocks, dividend growth funds, real estate investment trusts (REITs), and low-volatility ETFs naturally distribute capital across a broader array of economic sectors. While these strategies might lag during a raging tech bull market, they offer essential defensive characteristics if the market’s growth engine sputters.
Conclusion: Balancing Conviction and Regret
Ultimately, investors face a psychological tightrope walk. Going all-in on AI guarantees maximum exposure to the current market vanguard, but opens the door to catastrophic drawdown vulnerability. Conversely, completely abandoning mega-cap tech out of fear means running the risk of missing out on structural technological shifts if AI genuinely redefines global productivity.
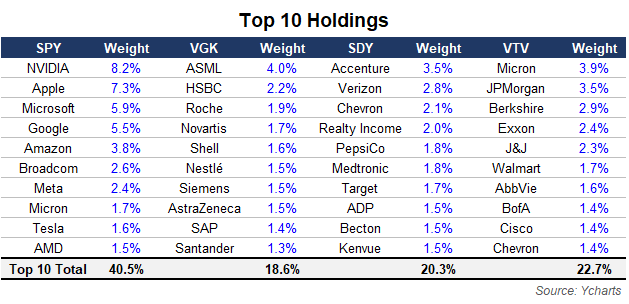
As experts note, avoiding extremes is the hallmark of sound long-term investing. Whether an investor chooses to stay put in low-cost index funds and let the market dictate winners, or intentionally branches out into dividend payers, international equities, and value factors to dilute concentration risk, the objective remains the same: structuring a portfolio that allows you to sleep at night without succumbing to the paralysis of regret.