Market Pulse: S&P 500 Nears Record Highs Amid Renewed Bullish Sentiment

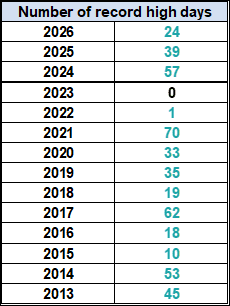
The U.S. equity markets have demonstrated remarkable resilience in recent weeks, with the S&P 500 posting its second consecutive week of gains. As of the most recent market close, the index climbed 1.3% from the previous Friday, signaling a robust appetite for risk among investors. Currently trading just 0.5% below its all-time closing high established on June 2, 2026, the index sits at a critical technical juncture. This article provides a comprehensive analysis of the current market environment, contextualizing recent performance against long-term historical trends, volatility metrics, and structural index comparisons.
The Current Landscape: A Snapshot of Stability
The S&P 500’s recent performance is not merely a short-term rally; it is the continuation of a broader trend of recovery and stabilization. Investors have closely monitored the index’s positioning relative to its key moving averages, which serve as essential gauges for institutional sentiment.

As of the latest data, the index has maintained its position above the 50-day moving average since June 29, 2026, and above the 200-day moving average since April 8, 2026. Perhaps most importantly, the "Golden Cross" formation—where the 50-day moving average sits above the 200-day moving average—has been in effect since July 1, 2025. This technical alignment is widely viewed by market technicians as a primary indicator of a sustained long-term bull market, suggesting that the structural integrity of the index remains intact despite pockets of periodic volatility.
Chronology: From Crisis to Recovery
To understand the current market position, one must look back at the historical trajectory of the index. The S&P 500’s journey since the mid-2000s has been marked by extreme cyclicality.

The Global Financial Crisis (GFC)
The narrative of modern market recovery is rooted in the aftermath of the 2007 peak. On October 9, 2007, the S&P 500 reached an all-time high of 1,565.15. The subsequent 17 months proved to be one of the most challenging periods in financial history, culminating in a trough on March 9, 2009, when the index closed at 676.53—a staggering 57% drawdown.
The road to recovery was arduous, requiring over five years of consolidation and growth before the index finally reclaimed its previous peak, closing at 1,569.19 on March 28, 2013. This period serves as a foundational lesson in market patience and the efficacy of long-term investment strategies.
Modern Drawdowns and Recent Volatility
While the post-2013 era has been defined by significant expansion, it has not been without its own corrections. The market landscape shifted notably in 2022, a year defined by macroeconomic headwinds that tested the resolve of even the most seasoned investors. When stripping away the historical shadow of the GFC and focusing on the post-2009 recovery, the volatility observed in 2022 stands out as a stark reminder of the market’s capacity for rapid, sentiment-driven repricing.
Supporting Data: Volatility and Performance Metrics
Market health is often measured not just by price appreciation, but by the nature of price movement.

Intraday Volatility Analysis
Volatility remains a critical component of the S&P 500’s profile. A comparison between closing prices and intraday ranges reveals significant shifts in market anxiety. On April 9, 2025, the index experienced a notable spike, with intraday price volatility reaching 10.77%. While this remains below the extreme levels seen on December 24, 2018 (19.10%), it highlights the sensitivity of the index to sudden news cycles.
The 20-day moving average for intraday swings currently sits at 1.05%, suggesting that while the market is active, it has settled into a pattern of moderate oscillation rather than extreme, unchecked variance.

Frequency of Movement
Data tracking the frequency of 1% daily moves—in either direction—provides further evidence of the current market’s temperament. Periods of high frequency in 1% moves are typically associated with institutional rebalancing and macroeconomic uncertainty. Comparing current correction frequency (defined as a drop of 10% or more from a record high) against historical norms confirms that while corrections are a natural feature of the equity markets, the current cycle has maintained a relatively disciplined trajectory.
The Case for Diversification: Market Cap vs. Equal Weight
A primary point of discussion among portfolio managers is the performance disparity between the standard market-cap-weighted S&P 500 and the S&P 500 Equal Weight Index.

The traditional S&P 500, which is heavily influenced by the largest technology and growth-oriented firms, currently boasts a year-to-date return of 10.7%. In contrast, the S&P 500 Equal Weight Index—which treats each of the 500 constituents with the same level of importance—is up 11.8% year-to-date. This outperformance of the equal-weight methodology suggests a broadening of market strength. When the equal-weight index outperforms the market-cap-weighted index, it serves as a signal that the rally is not merely concentrated in a few "mega-cap" stocks but is instead supported by a wider range of sectors, indicating healthier underlying market participation.
Implications for Investors
The current data offers several takeaways for those navigating the market:

- Resilience of Trends: The sustained positioning of the index above its key moving averages provides a degree of confidence for long-term investors. Markets tend to exhibit "momentum bias" when these moving averages are properly stacked.
- The Importance of Asset Allocation: The divergence between the market-cap and equal-weight indices underscores the necessity of considering broader exposure. Investors relying solely on cap-weighted ETFs, such as the iShares Core S&P 500 ETF (IVV), SPDR S&P 500 ETF Trust (SPY), Vanguard S&P 500 ETF (VOO), or SPDR Portfolio S&P 500 ETF (SPYM), may be missing out on the performance of smaller-cap constituents that are better captured by the Invesco S&P 500® Equal Weight ETF (RSP).
- Preparedness for Volatility: History, particularly the lessons from 2007–2009 and 2022, proves that drawdowns are inevitable. The current intraday volatility of 1.05% serves as a reminder to maintain a disciplined approach to risk management, ensuring that portfolios are positioned to withstand potential short-term corrections without sacrificing long-term goals.
Conclusion
As the S&P 500 hovers just shy of its record high, the broader market environment appears to be in a state of cautious optimism. The combination of technical strength, broader participation across market sectors, and a moderate volatility environment suggests that the current bull market retains substantial momentum. However, investors are advised to remain vigilant. The lessons of the past—from the depths of the Global Financial Crisis to the sharp corrections of recent years—serve as a permanent reminder that the market is a cycle of ebbs and flows. For those who can maintain a long-term perspective and leverage diversified strategies, the current snapshot of the S&P 500 provides a compelling narrative of ongoing growth in the face of persistent uncertainty.
Disclaimer: This report is for informational purposes only and does not constitute financial advice. Investors should consult with a qualified financial advisor before making any investment decisions based on the content provided.