The Myth of Buy-and-Hold: Why Stock Market Concentration Is Rewarding the Few and Punishing the Many
September 25, 2026
By Financial Markets Desk
Main Facts: The Great Divergence Beneath the Surface
At first glance, the headline numbers for the United States stock market in 2026 look robust, reassuring, and comfortably familiar to any investor who has ridden the post-pandemic bull run. Through the market close on Thursday, September 24, 2026, the benchmark S&P 500 index was up more than 13% on the year.
Yet, beneath this glossy veneer lies a stark, widening chasm. The popular market adage that "a dart-throwing monkey could beat most professional investors" is increasingly proving to be false—not because professional managers are suddenly brilliant, but because the underlying math of the stock market has fundamentally shifted. Far more individual companies fail to beat the index than succeed.
Despite the S&P 500’s double-digit gains, only 35% of all S&P 500 stocks are actually outperforming the index. Shockingly, 40% of the companies comprising the index are sitting on negative returns for the year, and a full quarter of S&P 500 corporations are down 10% or worse.
Household-name brands have taken a severe beating in 2026. Lululemon has plunged 51%, Nike is down 42%, Domino’s Pizza has dropped 28%, FedEx has slid 26%, and streaming giant Netflix has shed 24% of its value. Conversely, an elite cohort of high-fliers has more than doubled: 19 stocks in the index are up 100% or more, led by staggering surges from SanDisk (+665%), Dell (+341%), Intel (+232%), and CrowdStrike (+124%).
In baseball terms, the modern stock market features a remarkably low batting average paired with an extraordinarily high slugging percentage. There are plenty of towering home runs—powered heavily by artificial intelligence, cloud infrastructure, and semiconductor momentum—but there are an overwhelming number of strikeouts.
Chronology: The Decades-Long Erosion of the "Average Stock"
To understand how we arrived at this hyper-concentrated market environment, financial historians and analysts must look backward across multiple market cycles.
The Post-Dot-Com Era (Early 2000s)
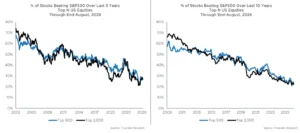
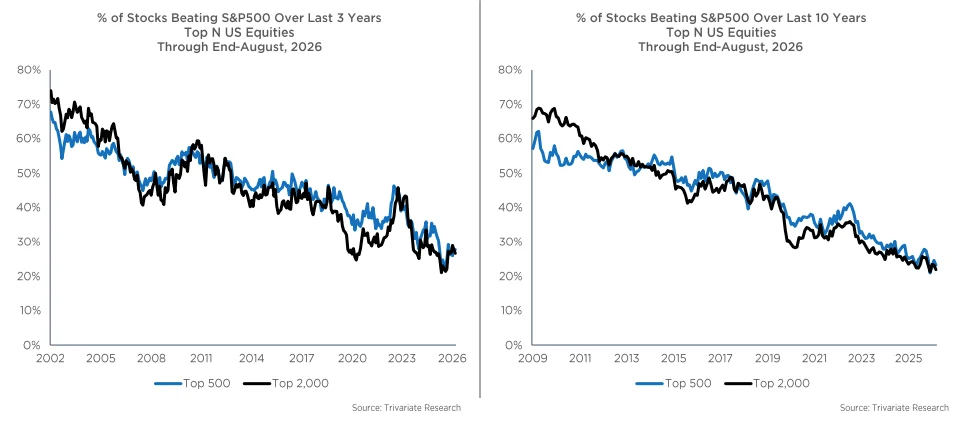
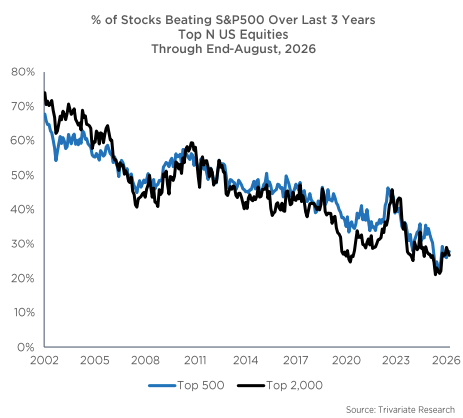
In the immediate aftermath of the dot-com bubble bursting, the stock market looked fundamentally different. Win rates for individual stocks—the percentage of equities beating the broader index—hovered comfortably in the 60% to 70% range. Diversification felt rewarding; owning a basket of mid-sized industrial or consumer discretionary stocks typically kept pace with or beat the market averages.
The 2010s: The Rise of Platform Monopolies
As the quantitative easing era took hold following the Great Financial Crisis, a new breed of technology titans began to pull away from the pack. Companies like Apple, Google, Amazon, and Microsoft leveraged network effects, zero-interest-rate policy (ZIPP), and aggressive capital reinvestment to swallow market share. Slowly, the percentage of individual stocks beating the S&P 500 began to dwindle.
The 2020s Pandemic and AI Boom (2020–2026)
The COVID-19 pandemic accelerated digital transformation, concentrating corporate profits into an even tighter cluster of mega-cap technology stocks. By 2024 and 2025, the generative AI boom turbocharged this dynamic.
By September 2026, the long-term historical data captured by researchers had reached an alarming tipping point. According to a landmark new report by Adam Parker of Trivariate Research titled Buy-and-Hold Doesn’t Work, the probability of an individual stock beating the S&P 500 over a multi-year horizon has plummeted to historic lows. Parker’s analysis revealed that only 23% of stocks have beaten the S&P 500 over the past 10 years, while the 3-year performance numbers paint a similarly dismal picture for passive stock-pickers. These grim statistics hold true whether analyzing the top 500 US stocks or expanding the scope to the top 2,000.
Supporting Data: The Expanding Spread of Winners and Losers
The numerical reality of the modern market is captured in the staggering divergence between winners and losers. The spread between outperforming and underperforming equities has widened to what analysts believe are unprecedented historical levels.
- The Three-Year Horizon: Over the past three years, stocks that lagged the S&P 500 underperformed the index by an average of 62%. Meanwhile, the winning cohort crushed the index, outperforming by an average of more than 100%.
- The Ten-Year Horizon: Over a decade-long view, the penalty for picking the wrong stock is catastrophic. Underperforming stocks over the last 10 years lost to the index by an average of 205%. Conversely, the long-term winners outperformed the index by an average of 600%.
Asset Concentration Snapshot (2026 Data)
| Metric | Percentage / Figure |
|---|---|
| S&P 500 YTD Return (As of Sept 24, 2026) | > +13% |
| S&P 500 Stocks Outperforming the Index | 35% |
| S&P 500 Stocks with Negative YTD Returns | 40% |
| S&P 500 Stocks Down 10% or Worse (YTD) | 25% |
| Stocks Beating S&P 500 Over 10-Year Period | 23% |
| Average Outperformance of 10-Year Winners | +600% |
| Average Underperformance of 10-Year Losers | -205% |
Paradoxically, the data suggests that it has actually been easier for individual stocks to outperform the market over a short, one-year timeframe than it has been over sustained 3-year or 10-year windows. This fleeting momentum creates an illusion of skill for retail and institutional investors alike, masking the long-term statistical trap of buy-and-hold individual stock selection.
Official Responses and Expert Analysis
The implications of this data have sparked intense debate among Wall Street strategists, portfolio managers, and financial commentators.
Market veteran Ben Carlson, writing on the dynamics of modern investing, pointed out the profound difficulty this environment creates for active managers. "You could make the case that this is the hardest environment of all-time for active managers," Carlson noted. "A handful of stocks did really well. Most stocks didn’t. If you were meaningfully different from the market-cap weighted index, you likely had a difficult time."
However, Carlson flips the script when considering individual retail investors. Ironically, the hyper-concentration of the market has made it a uniquely straightforward—albeit risky—time for everyday investors who practiced what legendary investor Howard Marks calls First-Level Thinking.
Howard Marks famously defined the two tiers of market psychology:
First-level thinking says: "It’s a good company; let’s buy the stock."
Second-level thinking says: "It’s a good company, but everyone thinks it’s a great company, and it’s not. So the stock’s overrated and overpriced; let’s sell."
For much of the current bull market cycle, second-level thinking has been a financial drag. Investors who tried to be clever by shorting richly valued tech monopolies or rotating into unloved value sectors frequently got crushed. Instead, first-level thinking—recognizing that Apple, Tesla, Google, Microsoft, Meta, and Nvidia are dominant, omnipresent tech companies and simply buying and holding them—proved to be a remarkably lucrative strategy.
Yet, financial analysts warn against extrapolating this era into infinity. Adam Parker’s research challenges the comfortable assumption that mega-cap tech stocks will reign supreme for eternity. Market history demonstrates that extreme concentration always eventually wanes. At some point, leadership rotates, multiples compress, and the broader market broadens out.
Implications: The Death of Passive Stock Picking and the Rise of Indexing
The empirical reality that buy-and-hold stock picking fails nearly 80% of the time over a decade carries profound implications for financial advisors, institutional funds, and individual wealth-builders.
1. The Perils of DIY Stock Picking
For decades, financial media promoted the idea that retail investors could build a resilient, market-beating portfolio simply by buying shares of companies they use and love in their daily lives. The data from 2026 invalidates this approach for the vast majority of portfolios. When 40% of the market is down in a double-digit bull year, selecting individual equities without rigorous risk management or momentum tracking is little more than an expensive lottery.
2. The Unassailable Logic of Index Funds
This environment highlights the structural beauty of passive index investing. In a market dominated by extreme outliers—where a handful of colossal winners drive nearly all the returns while dozens of high-profile companies stumble—an index fund automatically captures the winners. Because index funds are market-cap weighted, investors do not need to guess which chipmaker or AI startup will achieve a 600% gain; the index naturally allocates more capital to those winners as they scale, absorbing the losers along the way.
3. The Two Paths Forward: Hyper-Active or Ultra-Passive
As Ben Carlson and other market commentators conclude, the modern stock market leaves very little room for a middle ground. Investors are essentially forced to choose one of two paths:
- The Ultra-Passive Route: Owning a broad-market index fund (such as an S&P 500 or Total Stock Market ETF) to let the mathematical outliers do the heavy lifting.
- The Hyper-Active Route: Actively managing momentum, monitoring factor tilts, and maintaining strict stop-loss disciplines to navigate rapid shifts in leadership.
Looking Ahead
As the financial community processes Adam Parker’s Buy-and-Hold Doesn’t Work thesis alongside the 2026 performance metrics, the golden age of effortless stock-picking appears firmly in the rearview mirror. Whether market concentration eventually breaks or continues to dominate, investors are being forced to reckon with a sobering truth: in today’s stock market, the average company is no longer an average investment.