
Market Analysis: S&P 500 Faces Headwinds as Volatility and Moving Averages Signal Caution

The S&P 500, the bellwether for the broader U.S. equity market, concluded the week on a decidedly sour note, shedding 1.6% in a performance that has investors questioning the sustainability of the current bull run. As of the most recent market close, the index finds itself hovering just 0.5% below its all-time record high, which was established on June 2, 2026. This minor retreat from record territory, while statistically modest, has brought renewed attention to the technical health of the market and the underlying volatility that has begun to characterize the summer trading sessions.

Main Facts: A Week of Retreat
The recent dip reflects a broader sentiment shift among institutional and retail investors alike. After months of sustained optimism, the index’s inability to firmly break through its June 2nd ceiling has triggered a technical pullback.

Key performance indicators for the week underscore a period of heightened sensitivity:
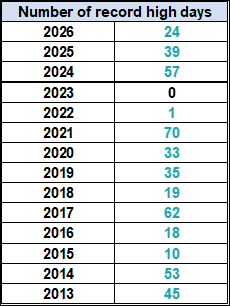
- Weekly Performance: The index closed down 1.6%, marking one of the more challenging weeks in the current quarter.
- Proximity to Highs: The index remains 0.5% below its record peak.
- Moving Average Breach: Perhaps most significantly, the index has slipped below its 50-day moving average as of July 17, 2026, a development often viewed by analysts as a bearish signal for short-term momentum.
- Year-to-Date Divergence: While the standard S&P 500 (market-cap weighted) is up 8.9% year-to-date, the S&P 500 Equal Weight Index has outperformed, posting an 11.4% gain. This suggests that the broader market breadth remains stronger than the top-heavy, mega-cap dominated headline index.
Chronology: From the Financial Crisis to Modern Volatility
To understand the current market environment, one must look at the historical context of drawdowns and recoveries. The S&P 500 has traveled a tumultuous path since the mid-2000s.

The 2007-2013 Cycle
On October 9, 2007, the S&P 500 hit a peak of 1,565.15. What followed was the Global Financial Crisis (GFC), a period of extreme deleveraging and market contraction. By March 9, 2009, the index had plunged approximately 57%, bottoming out at 676.53. It would take more than five years—until March 28, 2013—for the index to reclaim its 2007 peak, closing at 1,569.19. This era serves as a stark reminder of the "lost years" and the long-term patience required during structural market shifts.

Post-2009 Recovery and 2022 Turbulence
When adjusting for the GFC, the recovery trajectory becomes clearer. Since the March 2009 trough, the market has enjoyed secular growth punctuated by occasional corrections. However, 2022 marked a notable period of volatility, reminding investors that the path to record highs is rarely linear. The current 2026 cycle appears to be testing those same structural limits, as the index grapples with the transition from a low-interest-rate environment to a more complex economic landscape.

Supporting Data: Technical Indicators and Market Breadth
Technical analysis provides a granular look at the forces currently acting upon the market. The interaction between the 50-day and 200-day moving averages is particularly telling.

The Moving Average Tug-of-War
The 200-day moving average has acted as a critical support level, with the index remaining above it since April 8, 2026. Conversely, the 50-day moving average, which had been comfortably above the 200-day average since July 1, 2025, has now been compromised. When an index trades below its 50-day moving average, it often indicates a weakening in the immediate trend, forcing traders to re-evaluate their risk appetite.

Volatility Correlation
Intraday volatility has also seen a resurgence. On April 9, 2025, the market experienced a massive 10.77% intraday swing, the largest since the extreme volatility seen on December 24, 2018 (19.10%). Currently, the 20-day moving average for intraday price movement sits at 0.98%. This figure, while lower than the April spike, suggests that the market is "twitchy"—prone to sudden, sharp movements in response to economic data or geopolitical headlines.

Cap-Weighted vs. Equal Weight
A critical takeaway for portfolio managers is the performance disparity between the standard S&P 500 and the S&P 500 Equal Weight Index. The latter, which gives every constituent company an equal stake, is currently outperforming the market-cap-weighted version by 250 basis points year-to-date. This divergence highlights that while the largest tech-heavy constituents are experiencing a "cooling off" period, the underlying 500 companies are maintaining robust growth, offering a buffer against the volatility of the mega-caps.

Official Perspectives and Expert Consensus
Financial analysts and market strategists are currently divided on whether this pullback represents a healthy consolidation or the beginning of a deeper correction.

- The Bullish Argument: Proponents of the current trend argue that the S&P 500’s stability above the 200-day moving average indicates that the long-term bull market remains intact. They point to the strength of the Equal Weight index as evidence that participation in the market rally is broad-based, rather than limited to a handful of "market darlings."
- The Cautious View: Conversely, bears point to the breach of the 50-day moving average as a sign that the "easy money" phase of the 2026 rally has concluded. They emphasize that the 0.5% gap from the record high represents a psychological barrier that, if not broken soon, could lead to a test of lower support levels.
Implications for Investors
For the individual investor, the current market climate necessitates a disciplined approach. The data provided by the recent performance of ETFs like the iShares Core S&P 500 ETF (IVV), SPDR S&P 500 ETF Trust (SPY), and Vanguard S&P 500 ETF (VOO) shows that broad-market exposure remains the standard for long-term growth. However, those seeking to mitigate the risks of high-cap concentration may find the Invesco S&P 500 Equal Weight ETF (RSP) to be an increasingly attractive alternative.

Strategic Considerations:
- Rebalancing: With the S&P 500 showing signs of exhaustion near record highs, now is an opportune time for investors to review their asset allocation and ensure they are not over-exposed to sectors that have driven the recent, more volatile, rallies.
- Monitoring Volatility: The 0.98% average intraday range suggests that stop-loss orders and hedging strategies should be adjusted to account for higher daily variance.
- The "50-Day Rule": Historically, maintaining a position while the index is below the 50-day moving average requires higher conviction. Investors should monitor whether the index can recapture this level in the coming weeks.
As we look toward the remainder of the year, the interplay between the 50-day and 200-day moving averages will likely define the market’s tone. While the retreat from the June 2, 2026, high is a hurdle, it is not an insurmountable one. Whether the market finds support at its current levels or undergoes a deeper correction will depend on the upcoming earnings season and the broader macroeconomic signals that continue to influence the 500 largest U.S. companies. Investors are advised to remain vigilant, keep a close eye on market breadth, and prepare for a period where volatility, rather than steady growth, may be the defining characteristic of the trading day.