Navigating the Yield Curve: A Mid-2026 Analysis of Treasury Markets and Economic Signals

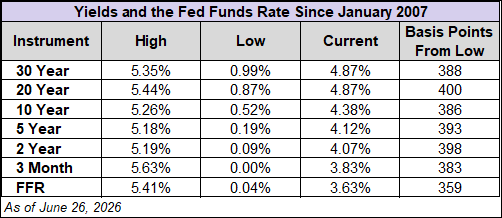
As of June 26, 2026, the American financial landscape remains firmly fixated on the movements of the U.S. Treasury market. Investors, policymakers, and institutional analysts continue to scrutinize the yield curve as the primary barometer for economic health, particularly as the Federal Reserve navigates the delicate transition from its previous tightening cycle toward current monetary adjustments. With the 10-year Treasury note yielding 4.38% and the 2-year note resting at 4.07%, the market is signaling a cautious outlook that blends historical precedent with modern macroeconomic volatility.
The Core Data: Understanding the Current Yield Environment
The relationship between short-term and long-term interest rates remains the central focus for market participants. The 10-year Treasury, often viewed as the global benchmark for risk-free borrowing, closed the June 26 session at 4.38%. Simultaneously, the 2-year Treasury note—the maturity most sensitive to Federal Reserve policy expectations—finished at 4.07%.

This differential, known as the "yield spread," is more than a mere numerical gap; it is a profound psychological indicator of where the "smart money" believes the economy is heading. When the spread between these two instruments narrows or inverts, it historically signals that investors are losing confidence in near-term economic growth, preferring the relative stability of long-dated bonds over the immediate liquidity of short-term debt.
Historical Context: A Journey Through Decades of Volatility
To understand the current state of the U.S. Treasury market, one must look back beyond the immediate post-pandemic era. The evolution of the 10-year Treasury yield provides a masterclass in economic history. Tracing the trajectory back to 1965, we see the foundation of the "stagflation" era of the 1970s—a period defined by the 1973 oil embargo and the subsequent struggle to tame runaway inflation.

In the decades that followed, the U.S. witnessed a secular decline in interest rates, punctuated by major market shocks, including the 2008 Financial Crisis and the unprecedented monetary expansion of the COVID-19 pandemic. By observing the daily performance of Treasury bonds overlaid against the Federal Funds Rate (FFR) since 2007, we can discern the precise moments where the Federal Reserve’s interventionist policies directly influenced the cost of capital, setting the stage for the current interest rate environment.
The Inverted Yield Curve: A Reliable Harbinger of Recession?
The most critical analytical tool in the investor’s kit is the inverted yield curve. By definition, an inversion occurs when shorter-term maturities offer higher yields than their longer-term counterparts. The 10-2 spread and the 10-3mo spread are the two primary metrics used to predict economic contraction.
The Mechanics of the 10-2 Spread
The 10-2 spread has been a remarkably reliable leading indicator for recessions. Historical data indicates that recessions typically occur between 18 and 92 weeks after the curve initially inverts. However, the signal is not infallible. The "false positive" of 1998 serves as a cautionary tale for those who rely solely on this metric.
In the current cycle, the 10-2 spread spent significant time in negative territory—most notably from July 5, 2022, to August 26, 2024. The most recent inversion occurred on September 5, 2024. When calculating the average lead time, analysts have found that if the first date of inversion is taken as the starting point, the average lead time to a recession is approximately 48 weeks (eleven months). If the calculation is anchored to the last positive spread before a recession, the lead time tightens to just 18.5 weeks (roughly 4.25 months).

The 10-3 Month Spread
The 10-3 month spread offers an even shorter-term view of market anxiety. Because the 3-month Treasury bill is highly sensitive to current Federal Reserve policy, its relationship with the 10-year note can often provide a more immediate warning signal. Lead times for this indicator range from 34 to 69 weeks. Much like the 10-2 spread, the 10-3 month metric has seen recent volatility, having been negative from October 2022 through December 2024. Since February 26, 2026, this spread has oscillated in and out of negative territory, reflecting the market’s ongoing indecision regarding the Fed’s path forward.
The Impact on Consumer Borrowing: The 30-Year Mortgage
While institutional investors track Treasury yields to forecast GDP growth, the average American feels the impact of these numbers through the 30-year fixed-rate mortgage. Conventional economic theory dictates that as the Federal Funds Rate rises, mortgage rates should follow suit.

However, the recent cycle has defied simple modeling. When the Federal Reserve began its rate-cutting campaign in September 2024, mortgage rates did not immediately mirror the downward trajectory of the FFR, occasionally moving in the opposite direction due to broader market expectations and liquidity premiums. As of the latest Freddie Mac Weekly Primary Mortgage Market Survey, the 30-year fixed rate stands at 6.49%. This figure remains a pivotal factor in the housing market’s recovery, as high borrowing costs continue to exert pressure on affordability, despite the cooling of inflationary pressures elsewhere in the economy.
Federal Reserve Intervention and Market Behavior
The relationship between the S&P 500, the 10-year Treasury, and the Federal Funds Rate reveals the extent to which modern market behavior is shaped by central bank policy. Since the 2008 financial crisis, the Federal Reserve has shifted from a passive overseer to an active participant in market pricing through quantitative easing and tightening cycles.

When the Fed adjusts the FFR, the impact ripples through the entire capital structure. The "Fed Put"—the informal expectation that the Fed will intervene to prevent market collapses—has fundamentally altered the risk-reward profile for equity investors. By analyzing the long-term interaction between these three variables, it becomes clear that the current market environment is highly sensitive to forward guidance. As we move through the remainder of 2026, the market is bracing for how the Fed will balance its dual mandate of price stability and maximum employment in an era of slowing growth.
Implications for Investors and Asset Allocation
For those managing portfolios in this environment, the yield curve provides a roadmap for defensive and offensive positioning. The current structure of Treasury yields suggests a "higher-for-longer" environment, even as the Fed begins to pivot.

Investors looking for exposure to these trends have several avenues. Exchange-Traded Funds (ETFs) such as the Vanguard 0-3 Month Treasury Bill ETF (VBIL) offer a way to capitalize on short-term rates with minimal duration risk. For those looking to capture intermediate-term yield, the Vanguard Intermediate-Term Treasury ETF (VGIT) remains a popular choice, while the Vanguard Long-Term Treasury ETF (VGLT) provides exposure for those anticipating that long-term yields may continue to decline as economic growth cools.
Conclusion: Looking Ahead to Late 2026
As we conclude the second quarter of 2026, the message from the Treasury market is one of transition. The yield curve, though showing signs of normalization, remains a testament to the uncertainty that has defined the last two years. While the specter of a recession remains a constant subject of debate, the data—when viewed through the lens of history—reminds us that market cycles are inevitable, and the signals provided by Treasury yields are the most reliable indicators we have for navigating them.

Investors should remain vigilant, focusing on the spread between short-term and long-term maturities, and monitor the Federal Reserve’s communication closely. Whether the economy achieves a "soft landing" or enters a period of contraction, the Treasury market will continue to be the primary arbiter of value and risk in the global financial system.
For those seeking to deepen their understanding of these market dynamics, the Fixed Income Content Hub provides ongoing analysis and strategic updates. Professionals looking to earn continuing education (CE) credits and explore advanced portfolio strategies are encouraged to leverage institutional resources to stay ahead of the evolving macroeconomic curve.