
The "Uptober" Illusion: Why Bitcoin is Flipped by Macro Headwinds and Technical Compression

Main Facts
Cryptocurrency markets have once again subverted historical seasonality. October—traditionally dubbed "Uptober" within crypto trading circles for historically delivering some of Bitcoin’s most robust yearly gains—is proving to be a month of unexpected turbulence. Bitcoin has slid 2.67% over a 24-hour window to trade at $81,125, effectively erasing nearly half of the asset’s recovery gains accumulated through September.
This counter-seasonal performance mirrors a trend-breaking reversal witnessed the year prior. Instead of following the reliable cyclical pattern of a sluggish "Red September" launching into a hyper-bullish "Uptober," the broader crypto market is dealing with heavy macroeconomic pressure. Elevated Treasury yields, stubbornly high energy prices, tightening monetary policy expectations, and widespread derivatives liquidations are colliding to suppress upside momentum.
Despite maintaining an intact long-term structural uptrend on daily charts, Bitcoin is flashing warning signs on shorter timeframes. Spot exchange-traded funds (ETFs) are experiencing historic bleeding, hundreds of millions of dollars in leveraged positions have been forcefully wiped out, and technical indicators are pointing toward compressed volatility that could soon trigger a decisive market breakout—in either direction.
Chronology of the Decline
The current market correction did not happen in a vacuum; it is the culmination of weeks of sideways consolidation and compounding macroeconomic shocks.

Late September: The Peak and Stalling Momentum
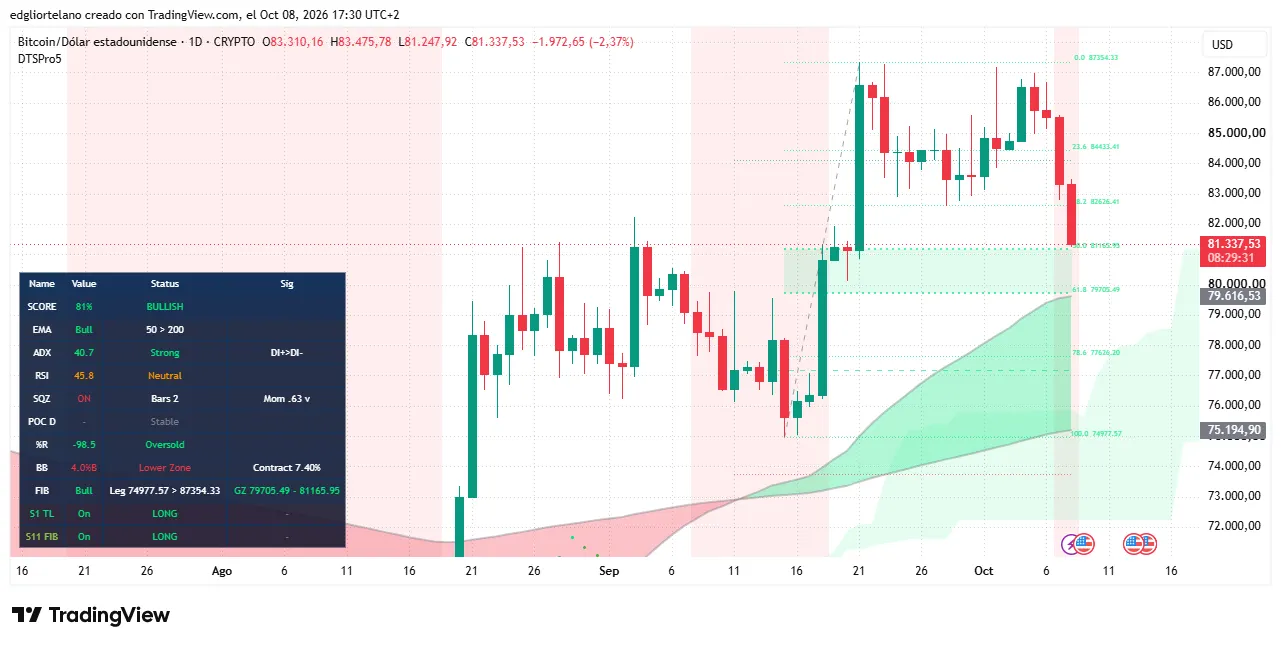
Following a local price peak of $87,354.33 on September 21, Bitcoin entered a prolonged consolidation phase. For more than two weeks, the leading cryptocurrency traded sideways within a tight band between $83,000 and $87,000. While bulls initially hoped this range-bound action was a launching pad for October rallies, momentum was quietly fading.
Mid-Week Macro Shock
The turning point arrived midweek as traditional financial markets pulled back from record highs. On Wednesday, macro pressures converged: Brent crude hovered near $100 a barrel, U.S. Treasury yields touched levels not seen since 2002, and the release of the latest Federal Reserve meeting minutes revealed that most central bank officials anticipate another interest rate hike before the end of the year.
The Sell-Off and ETF Bleeding
As equities and gold retreated, Bitcoin sold off in tandem. On October 7, U.S. spot Bitcoin ETFs recorded a staggering $484.9 million in net outflows—marking the worst single-day withdrawal performance for the product category since June. This single session wiped out roughly 81% of the $595.3 million that had entered the funds over the preceding nine trading days.
The 24-Hour Cascade
As prices breached critical technical floors, automated risk-management systems triggered a cascading series of liquidations. Over a 24-hour period, approximately $429 million in leveraged trading positions were forcefully closed out across derivatives exchanges, with an overwhelming 87.5% of those liquidated positions belonging to bullish traders (longs).

Supporting Data and Technical Analysis
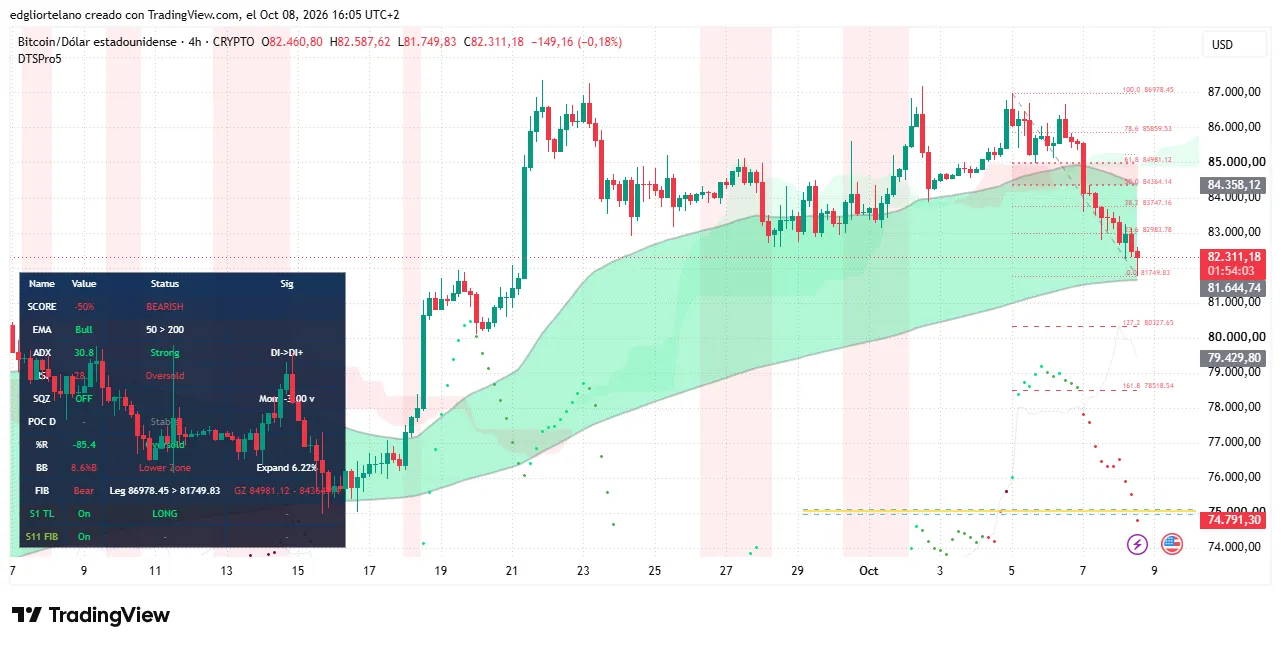
A deep dive into Bitcoin’s technical architecture reveals a stark divergence between daily macro charts and intra-day indicators, highlighting an asset caught in a tightening spring.
Daily Trend Stability vs. Intra-Day Softening
On the daily chart, Bitcoin’s broader structural trend remains technically intact. The 50-day exponential moving average (EMA) continues to sit comfortably above the 200-day EMA, preserving the "golden cross" configuration that technical analysts view as the hallmark of a macro bull market.
However, the daily opening and closing candles tell a story of dwindling defense. Today’s daily candle opened at $83,310.16, struggled to break past $83,475.78, and subsequently plummeted to intraday lows of $81,337—a 2.37% daily decline that easily broke through yesterday’s $82,776.30 support floor.
Momentum and Volatility Indicators
- Average Directional Index (ADX): The daily ADX sits at 40.7 (down slightly from 42.8 yesterday). While any reading above 25 confirms a strong trend, the declining figure suggests that the underlying trend strength is cooling. Buying pressure (+DI) maintains a slight edge over selling pressure (-DI), but the gap is narrowing.
- Relative Strength Index (RSI): Momentum has undeniably softened. The daily RSI has fallen to 45.8, slipping below the crucial 50 centerline that separates bullish from bearish momentum territory.
- Squeeze Momentum Indicator: This indicator remains active, signaling that market volatility is currently compressed like a coiled spring. Traders recognize this pattern as a precursor to a sharp, high-volume directional move.
ETF Flow Dynamics
Despite the bruising $484.9 million outflow on October 7, the broader institutional picture remains resilient rather than catastrophic. The massive single-day redemption reduced the 10-day net inflow total to a modest $110.4 million. Crucially, cumulative net inflows since the inception of spot Bitcoin ETFs stand firm at $57.8 billion. Analysts classify the recent outflow event as a localized dent rather than an institutional exodus.
Derivatives and Liquidation Metrics
According to CoinGlass data, the market flush caught leveraged speculators completely off guard. Of the $429 million liquidated over a 24-hour span, Bitcoin positions accounted for $135.51 million, while Ethereum added another $96.14 million in liquidations. Notably, nearly half of the total washout ($202.24 million) occurred within a compressed four-hour window, underscoring how rapidly forced selling can accelerate price drawdowns.
Official Responses and Market Perspectives
Market participants, economists, and technical analysts are currently divided on whether the current dip represents a routine mid-cycle correction or the beginning of a deeper macro-driven winter.
Traditional market analysts point directly to central bank policy as the primary driver of current sentiment. The revelation that Federal Reserve officials are leaning toward a potential rate hike to combat stubbornly sticky inflation has poured cold water on risk-on assets. High Treasury yields offer institutional investors a lucrative, risk-free yield alternative, reducing the immediate appetite for volatile alternative assets like cryptocurrencies.
Conversely, crypto-native analysts maintain that on-chain metrics and historical halving-cycle dynamics still favor long-term accumulation. Discussions across trading desks highlight that pullbacks within established bull markets frequently test historical moving averages and buyer-dense "golden zones" before resuming their upward trajectories.
Prediction markets, such as Myriad, have seen a sharp uptick in speculative participation as retail traders attempt to gauge how low Bitcoin might drop before finding a firm macroeconomic bottom.
Implications for Investors and Market Outlook
As the market navigates the remainder of October, several critical price levels and macroeconomic catalysts will dictate Bitcoin’s immediate trajectory.
Critical Levels to Watch
- The $82,626.41 Threshold: A confirmed daily close below this short-term price zone would validate the breakdown of weak support, signaling the continuation of a broader bearish correction. Conversely, reclaiming this level would re-engage the multi-week sideways range.
- The Golden Zone ($81,165.95 to $79,705.49): Positioned immediately below current trading levels, this historically reliable retracement zone is where pullbacks within primary uptrends routinely attract institutional and retail buyers. The upper boundary of the daily trend band sits at $79,661.95—just $44 away from the lower edge of this zone—making it a crucial line in the sand for bulls.
Upcoming Catalysts
Investors are advised to monitor a complex web of external catalysts over the coming weeks:
- Geopolitical and Energy Markets: Ongoing headlines regarding oil prices (particularly Brent crude) and shipping disruptions in vital trade routes like the Strait of Hormuz will continue to influence global inflation expectations and stock market performance.
- Institutional Flows: Daily volume reports on spot Bitcoin and Ethereum ETFs will determine whether institutional investors view current price levels as a buying opportunity or a signal to scale back exposure.
- Macroeconomic Data and Fed Meetings: Treasury yield movements and anticipation surrounding the upcoming Federal Reserve meeting scheduled for October 27–28 will heavily dictate risk appetite. While current consensus views a rate hike during this specific meeting as unlikely, forward guidance regarding monetary policy will be heavily scrutinized.
Ultimately, while "Uptober" may be failing to deliver its promised fireworks, the compression of market volatility suggests that Bitcoin is preparing for a definitive breakout. Whether that breakout reclaims the mid-$80,000 range or tests deeper macroeconomic supports will depend entirely on how the intersection of traditional finance and digital assets resolves in the weeks ahead.