The Most Brutal Bond Market in Modern Finance: Anatomy of a Historic Fixed-Income Meltdown and the Case for Recovery
Main Facts: The Unraveling of the Bloomberg Aggregate Bond Index
For nearly half a century, the Bloomberg Aggregate Bond Index—colloquially known as "The Agg"—has served as the undisputed North Star for fixed-income investors. Created by Lehman Brothers in the early 1980s to establish a reliable benchmark for the investment-grade taxable bond market, the index spans more than 10,000 individual securities. It is a diversified basket consisting primarily of U.S. Treasuries, corporate bonds, mortgage-backed securities (MBS), and asset-backed securities (ABS). It acts not only as the primary performance hurdle for active managers of institutional capital, but also as the foundational proxy for the vast majority of total bond market index funds held by retail investors.
Today, however, the Agg carries a far less enviable distinction: it anchors what has arguably become the most brutal bond market in modern financial history.
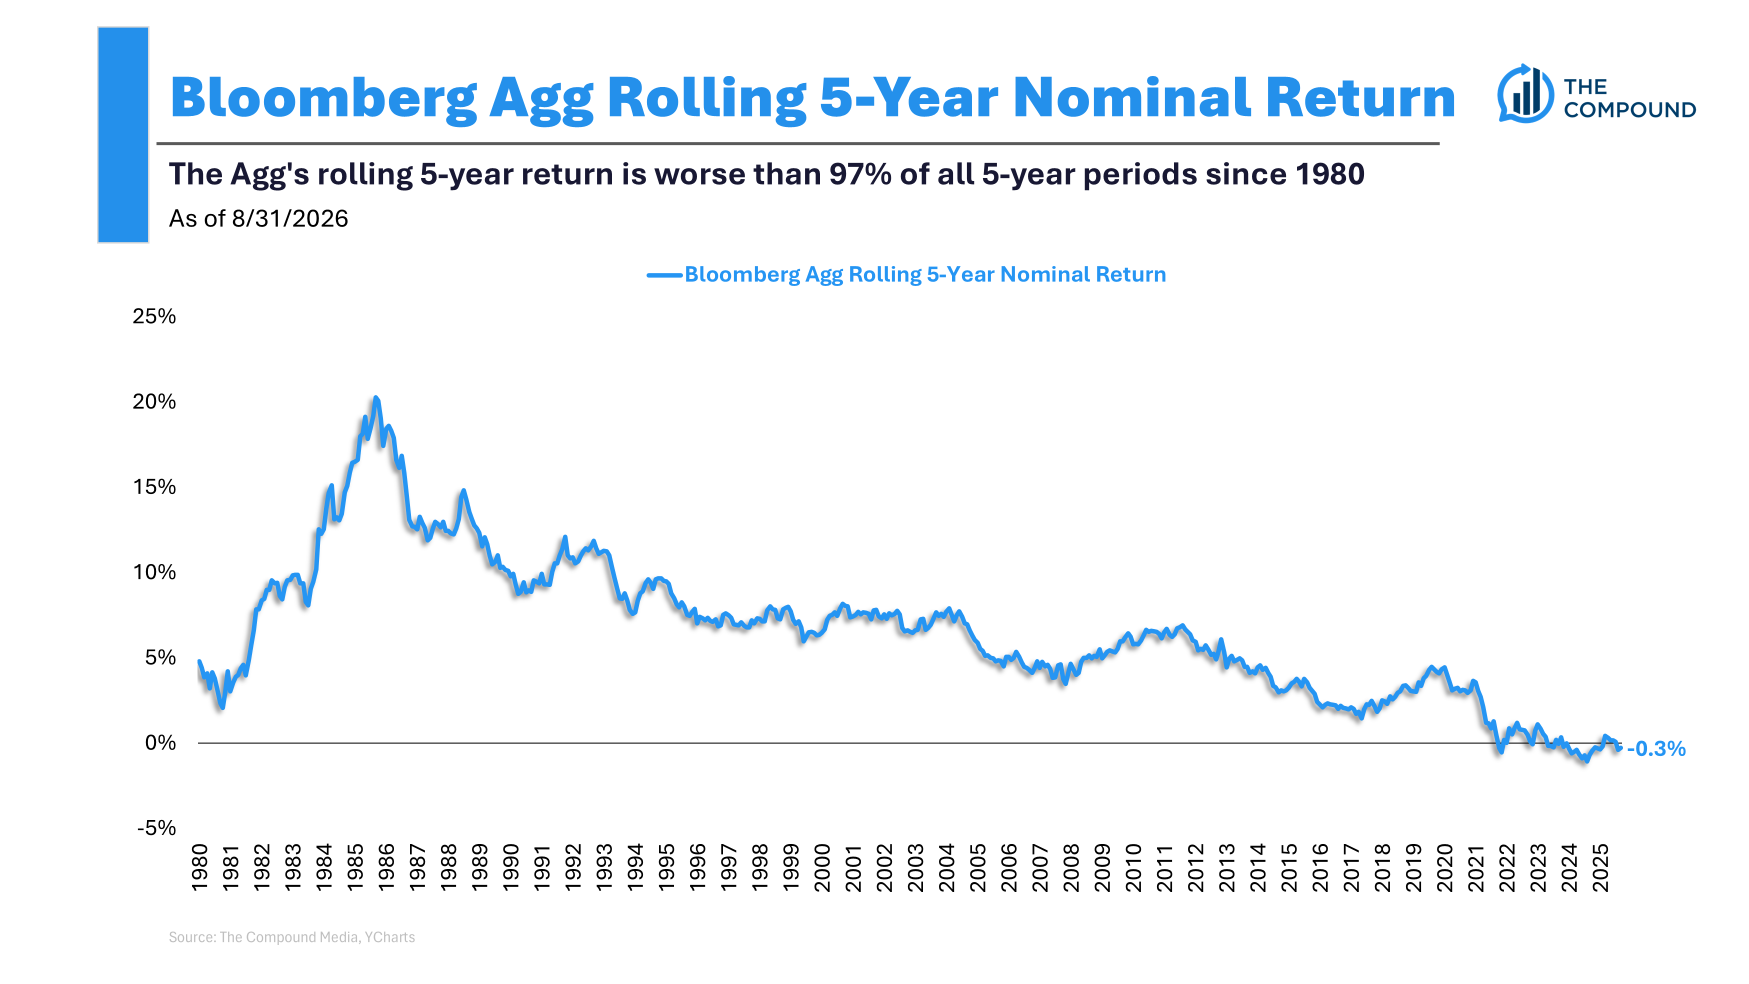
Following historical data backfilled by Lehman to an official inception date of 1976, the fixed-income asset class has recently delivered rolling 5-year and 10-year returns that rank among the worst ever recorded. Most notably, the recent cycle marks the first time in the entire history of the index that rolling 5-year returns have plunged into negative territory. While rolling 10-year nominal returns remain narrowly positive, bond investors narrowly skirted what would have been an unprecedented "lost decade" during the severe fixed-income bear market of 2022.
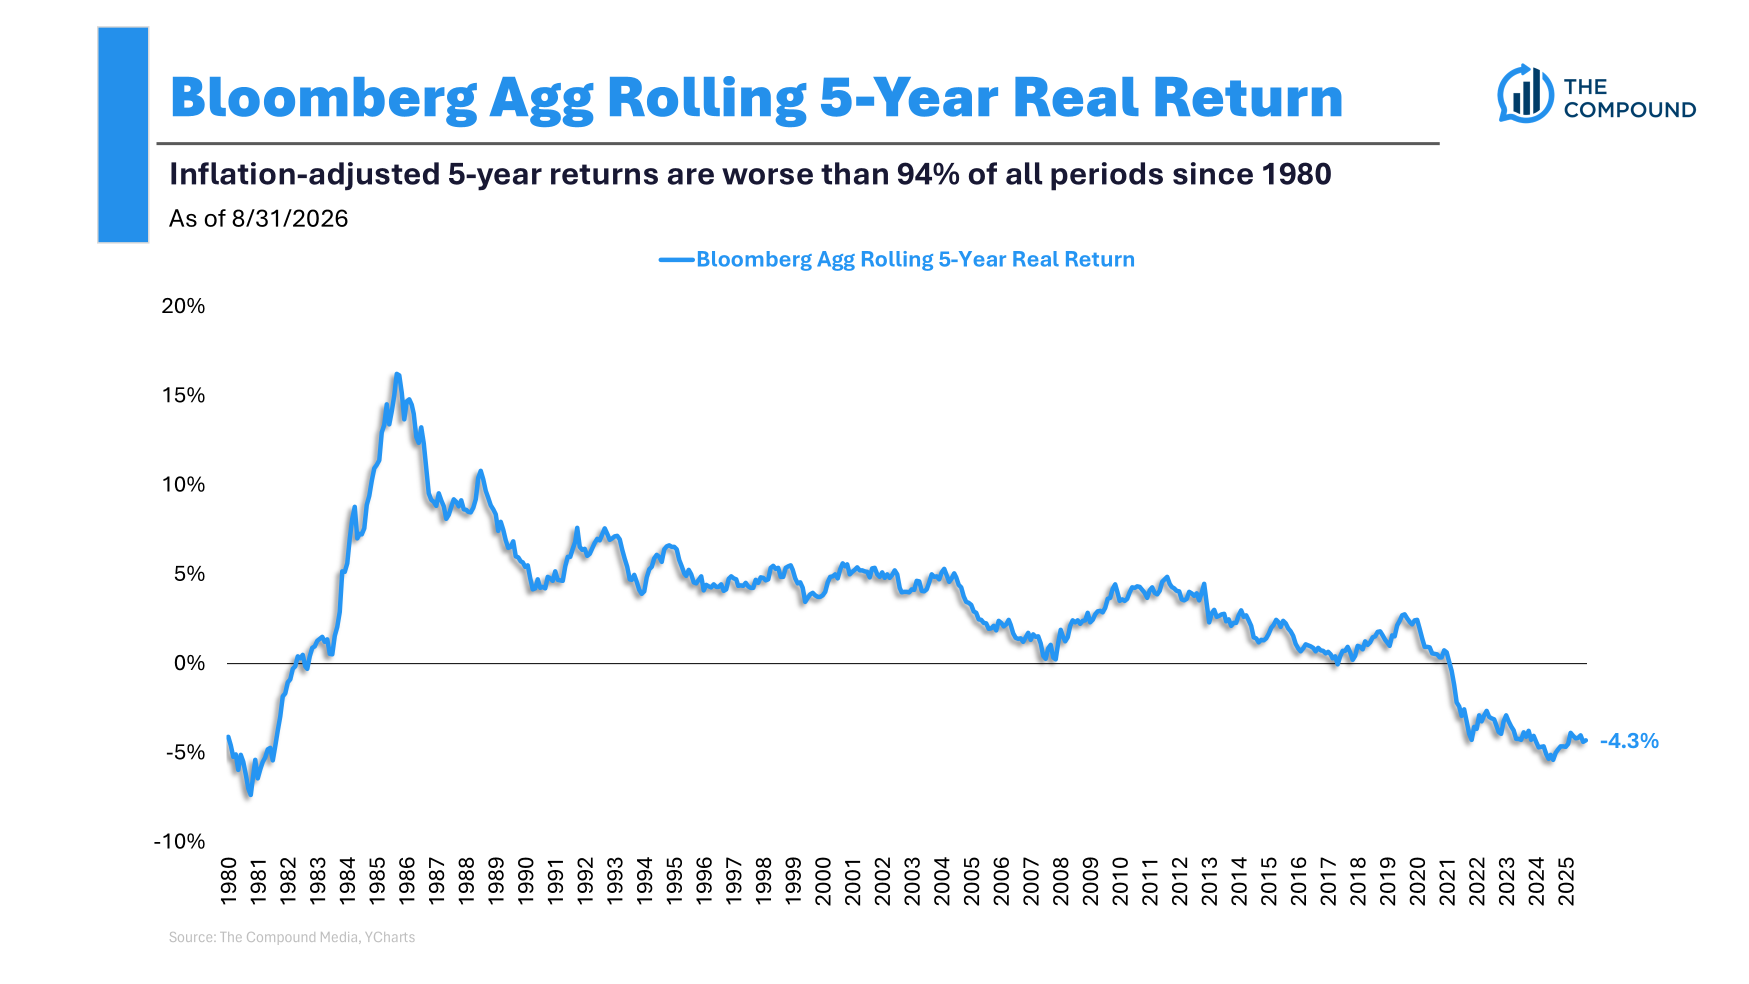
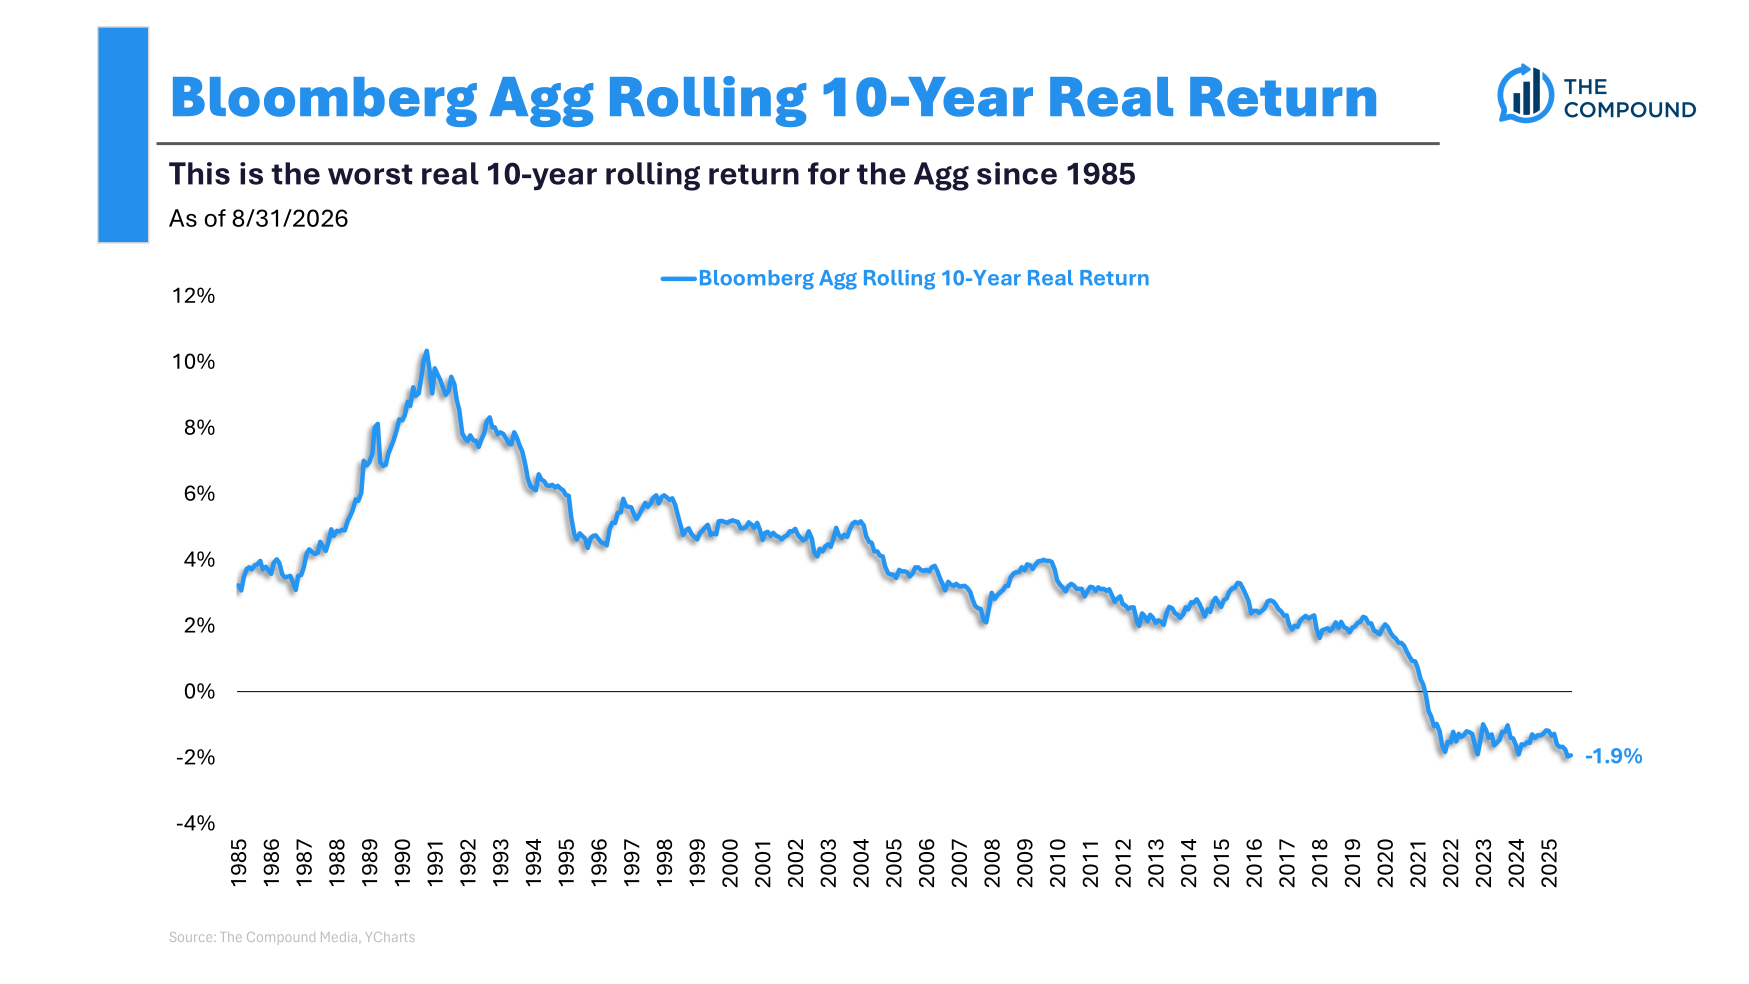
When adjusted for inflation, the picture turns even bleaker. Real 5-year and 10-year returns have hit historic troughs, rivaling or exceeding the destruction wrought during the double-digit inflation spirals of the late 1970s and early 1980s. This prolonged period of capital erosion has transformed bonds from the dependable ballast of a traditional portfolio into what many market commentators now categorize as the most hated asset class in the world.
Chronology: From the Era of Lehman Brothers to the 2022 Perfect Storm
To understand how the bedrock of conservative investing suffered such catastrophic losses, it is necessary to retrace the chronological evolution of the modern bond market.
The Formative Years (1976–1994)
When the index was conceived in the early 1980s—under the original Lehman Brothers banner, before undergoing subsequent corporate rebrandings that liken it to a sports stadium cycling through corporate sponsors (Barclays, and ultimately Bloomberg)—the macroeconomic landscape was defined by soaring inflation and extraordinarily high interest rates. Yet, paradoxically, the early years of the index did not experience negative nominal returns.
From 1976 through 1981, the Agg did not post a single negative calendar year. The very first down year in the index’s history did not materialize until 1994, when it slipped by a modest 3% during an unexpected Federal Reserve tightening cycle. Even during the volatile late 1970s, the worst annual performance for the Agg occurred in 1978, when it squeaked out a positive nominal return of 1.4%. While inflation bit heavily into real purchasing power, high starting yields provided a cushion that prevented nominal price collapses.
The Low-Yield Era and the 2020 Pivot
For decades following the 1994 stumble, the Agg enjoyed a generally benign environment characterized by falling or low interest rates, which consistently flattered bond prices through capital appreciation.
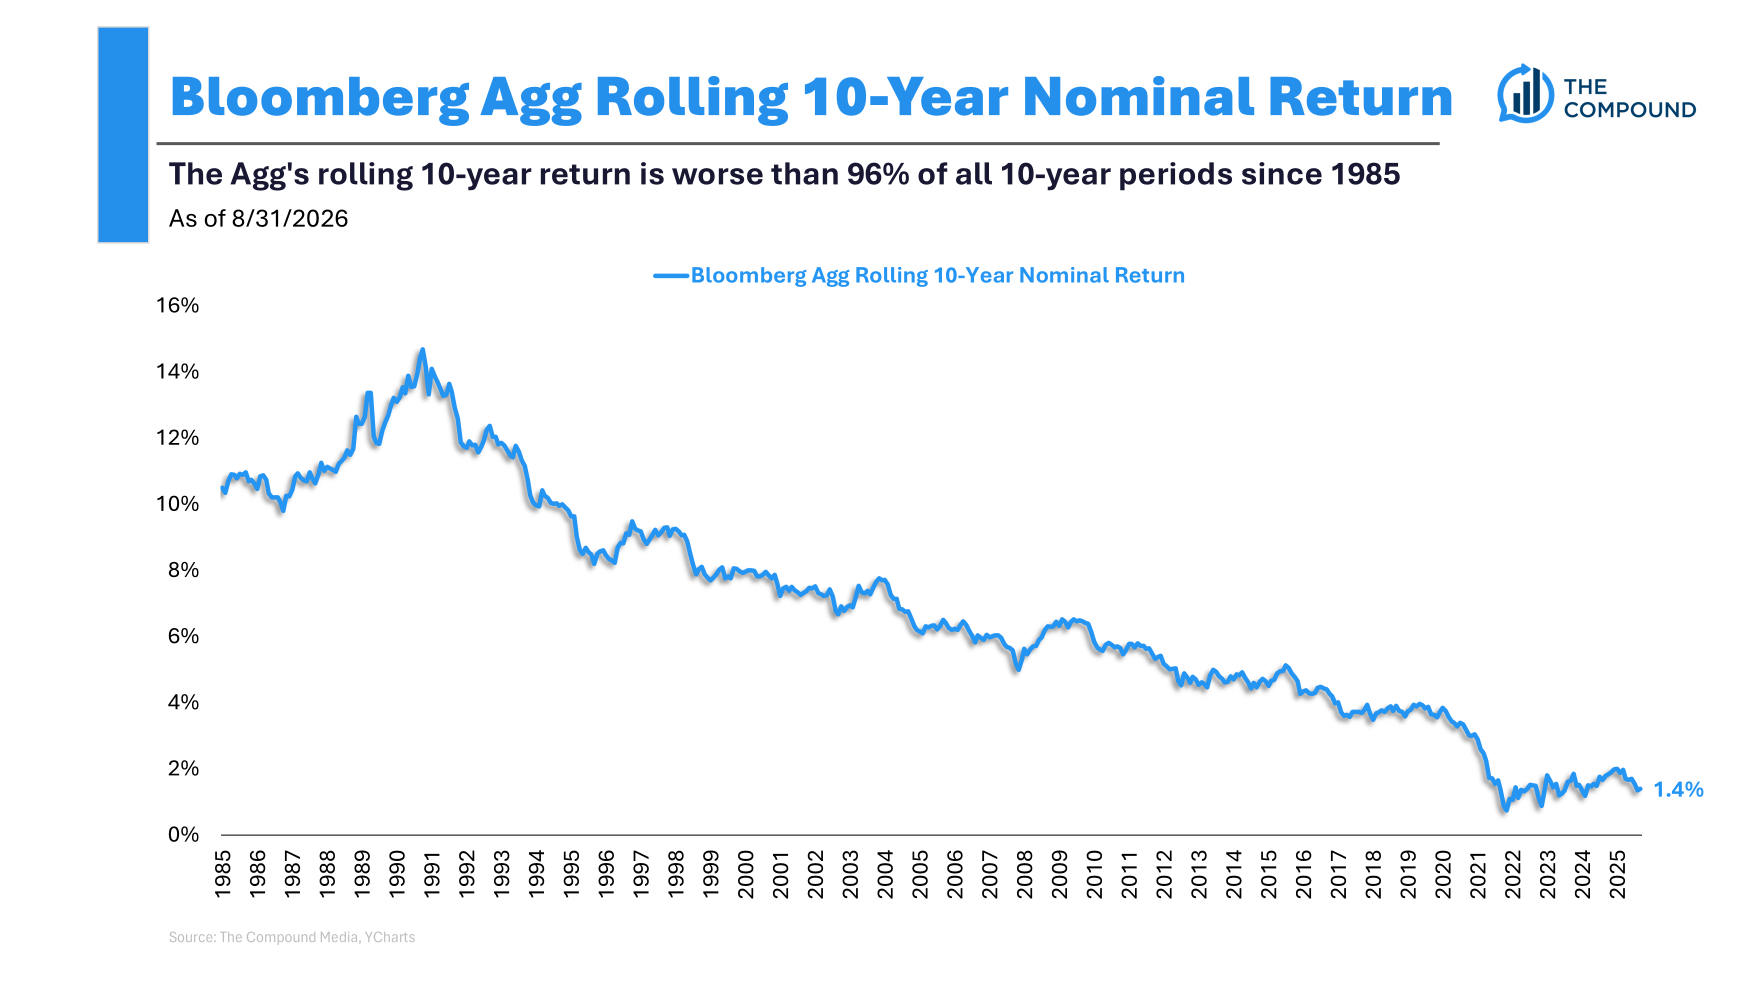
This multi-decade tailwind ended abruptly in 2020 as global central banks slashed interest rates to historic lows to combat pandemic-induced economic shocks. Yields compressed to near-zero levels, setting the trap for what would become the deepest drawdown in the history of investment-grade intermediate-term bonds.
The 2021–2022 Meltdown
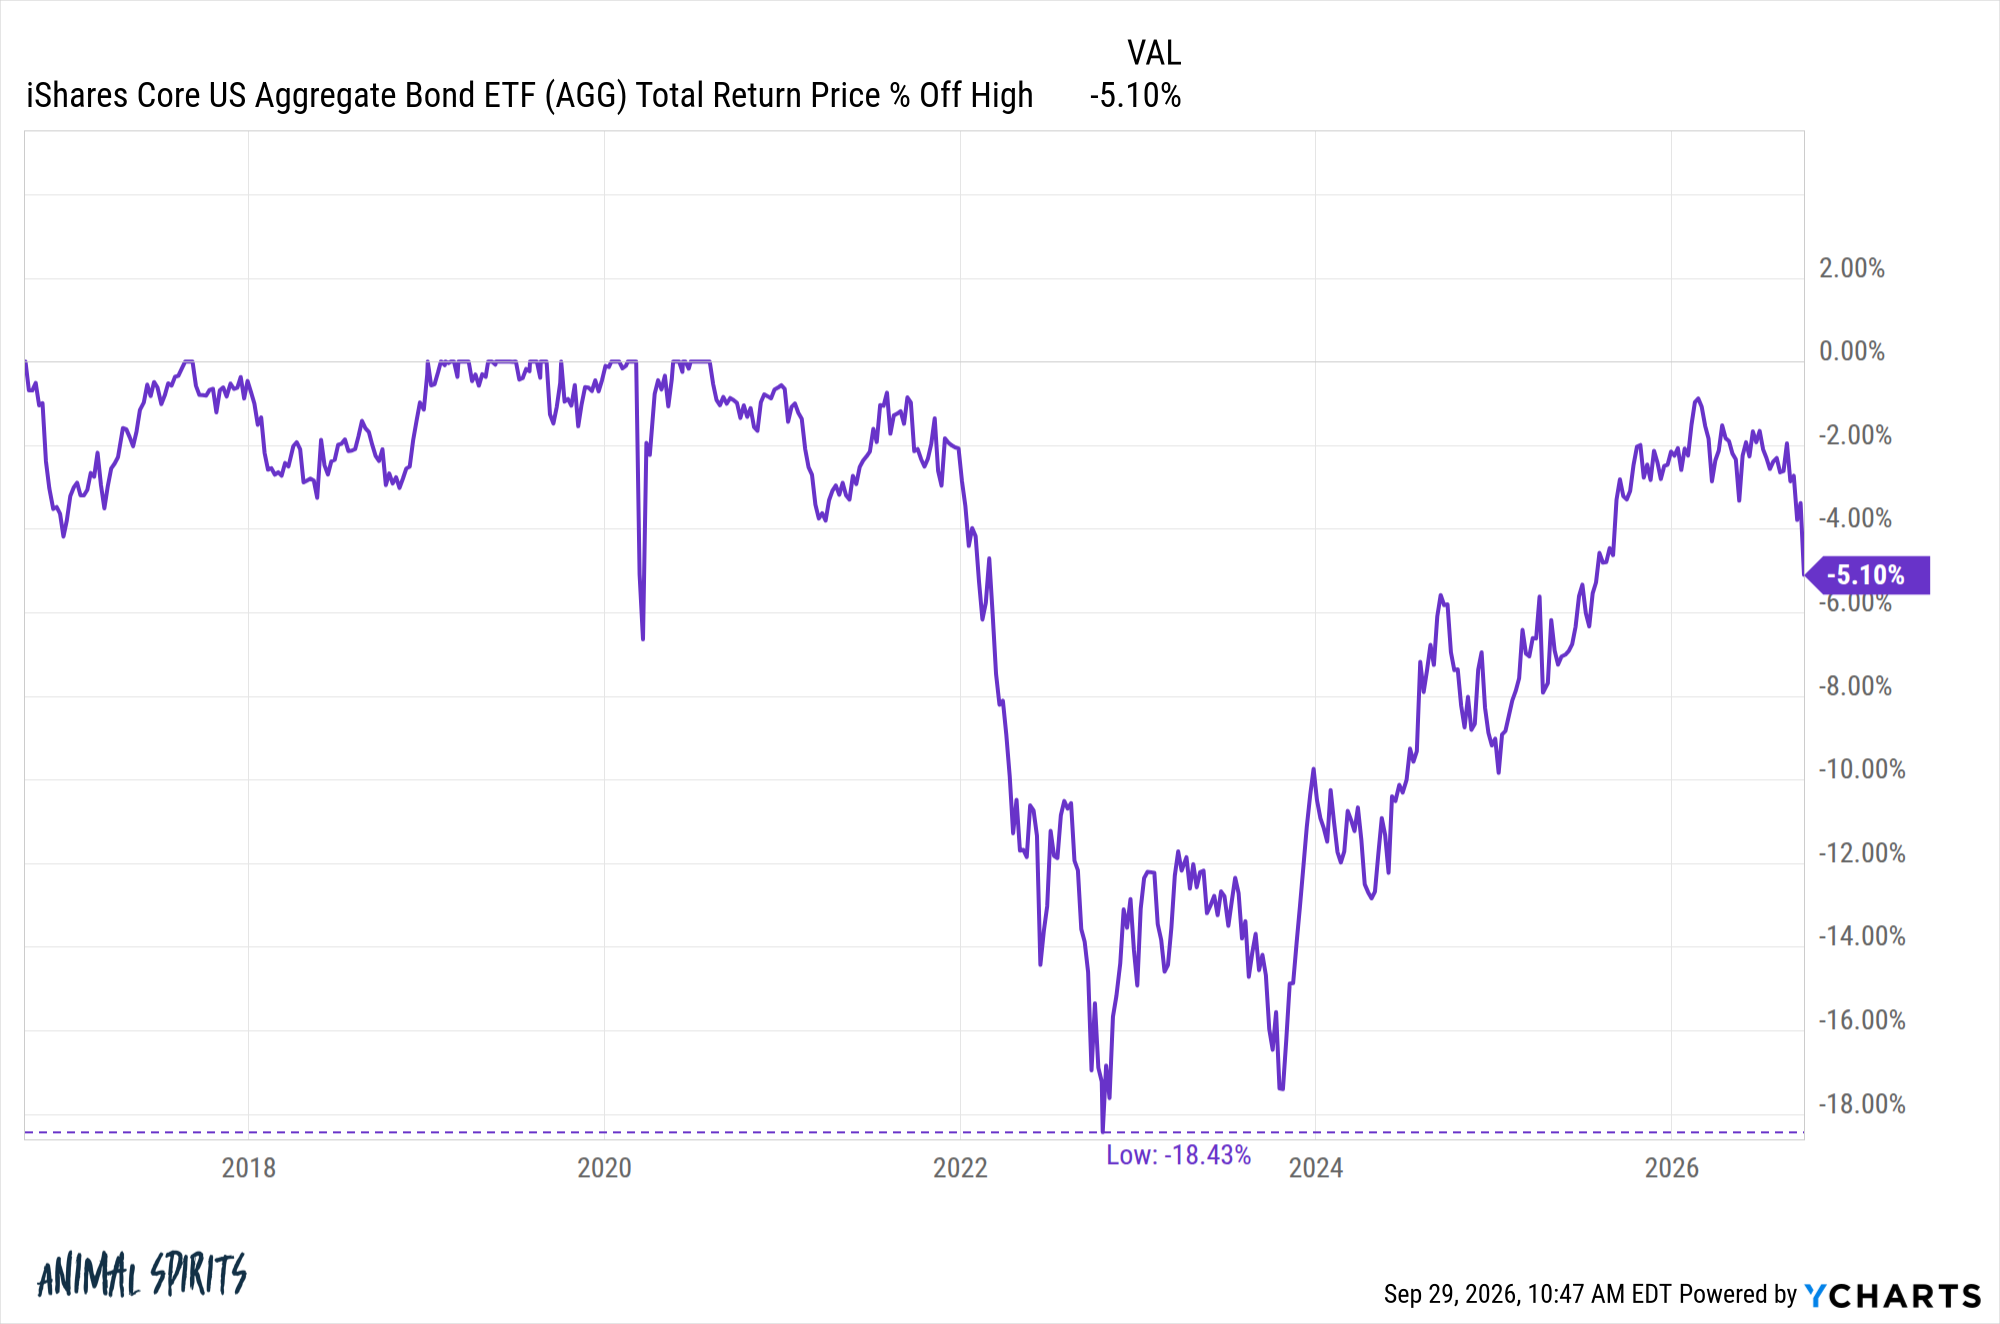
The turning point arrived with a vengeance in 2021 and 2022. For the first time in its history, the Agg suffered back-to-back negative calendar years: a minor 1.5% drop in 2021, followed by an unprecedented 13% collapse in 2022—the first double-digit annual decline the index had ever experienced.
From peak to trough, the bond bear market that commenced when interest rates bottomed in 2020 inflicted a drawdown approaching 20% on the Agg. For an asset class designed to preserve capital and offset equity market volatility, a 20% loss was a profound shock to millions of investors.
Supporting Data: The Anatomy of a Perfect Storm
The historic pain inflicted upon fixed-income portfolios over the past half-decade was not the result of a single variable, but rather a "perfect storm" fueled by three compounding factors:
- Extremely Low Starting Yields: Following years of aggressive monetary easing and quantitative easing by global central banks, starting yields across the fixed-income universe sat near all-time lows heading into the 2020s. Consequently, bonds offered very little income generation to cushion against capital losses.
- Rapidly Rising Interest Rates: When inflation surged in the wake of pandemic fiscal stimulus and supply chain fractures, the Federal Reserve was forced to execute one of the most aggressive monetary tightening campaigns in its history. Because bond prices move inversely to interest rates, the velocity of the rate hikes crushed asset valuations.
- Persistent High Inflation: Nominal returns were eroded by consumer price growth that far outpaced historical averages, driving real (inflation-adjusted) returns to historic lows.
Historical performance charts illustrate this breakdown vividly. Typically, a strong linear relationship exists between a bond index’s starting Yield to Maturity (YTM) and its subsequent 5-year forward returns; higher starting yields reliably predict higher future gains. However, during the current decade, this relationship broke down severely. Because interest rates rose so far, so fast, from such depressed initial levels, actual forward returns severely underperformed even the modest expectations dictated by starting yields. In short, the bond market performed even worse than raw math suggested it should have.
Official Responses: The Limits of Central Bank Forecasting
As fixed-income markets reeled from tightening cycles, policymakers at the Federal Reserve and other major central banks faced intense scrutiny over their inflation modeling and interest rate guidance.
In the years leading up to the 2022 inflation surge, central bank messaging consistently characterized rising price pressures as "transitory," leading many institutional managers and retail investors to position portfolios under the assumption that low interest rates would persist. When inflation proved stubborn and broad-based, the Fed was compelled to pivot abruptly, engineering rapid, oversized rate hikes that caught the financial sector off guard.
Market strategists and economists have repeatedly emphasized a humbling reality: predicting the direction, timing, and magnitude of interest rate movements remains virtually impossible, even for the architects of monetary policy themselves.
As prominent market commentators frequently observe, institutional forecasters and Federal Reserve officials alike possess a notoriously poor track record when it comes to forward-looking interest rate predictions. This institutional reality underscores why macroeconomic forecasting should rarely, if ever, form the cornerstone of an individual investor’s fixed-income strategy. Attempting to time Federal Reserve policy pivots or geopolitical developments—such as persistent conflicts in the Middle East or fluctuating global commodity shocks—introduces speculative risk into an asset class whose primary virtue is stability.
Implications: The Silver Lining and a New Era for Fixed Income
While the rear-view mirror reveals a brutal decade for bondholders, the forward-looking outlook offers a starkly different narrative. The very mechanism that caused such severe capital losses—soaring interest rates—has simultaneously birthed a vastly improved opportunity set for income-seeking investors.
Higher Starting Yields Shape a Brighter Future
Because investors lived through a harrowing period of negative performance, the compensation for holding fixed income has returned to levels unseen in nearly two decades. The average Yield to Maturity for the Bloomberg Aggregate Bond Index currently hovers around 5.5%, with high-grade corporate debt and U.S. government paper offering similarly attractive entry points.
- Cash and Equivalents: Yields remain robust near 4%.
- U.S. Government Bonds: Yielding upwards of 5%.
- The Aggregate Bond Index: Approaching 6%.
- Corporate and High-Yield Debt: Offering yields exceeding 6% and climbing higher for investors willing to assume additional credit risk.
These elevated starting yields fundamentally alter the math of fixed-income investing. While further monetary tightening could trigger temporary, short-term price volatility, that pain is now heavily cushioned—and ultimately overridden—by robust baseline income generation. Higher interest rates today mean higher expected forward returns tomorrow.
Strategic Takeaways for Investors
For those managing wealth through this transition, the implications are clear:
- Abandon Macro Forecasting: Do not attempt to predict the path of interest rates or inflation. The bond market’s recent history proves that even central banks miscalculate these variables.
- Focus on Fundamentals: Base fixed-income allocations on core structural metrics: yield, credit quality, duration, and maturity.
- Reevaluate the Portfolio Ballast: While cash and floating-rate debt provided safe havens during the recent bear market, intermediate and core bonds are once again capable of performing their traditional role—generating dependable income and providing diversification against potential equity market downturns.
The past decade has undoubtedly been a painful crucible for fixed-income investors. Yet, for those willing to look past the historic wreckage of the early 2020s, today’s bond market offers a generational reset, providing income levels that make the asset class worth holding once again.