Riding the S&P 500 Wave: The Psychology, Mathematics, and Reality of Secular Market Cycles
October 18, 2026
By Ben Carlson (Adapted and Expanded)
Main Facts
As the financial markets closed the books on the first nine months of 2026, a familiar yet pressing debate has reignited among equity analysts, portfolio managers, and everyday investors: How much longer can the stock market defy the laws of mathematical gravity?
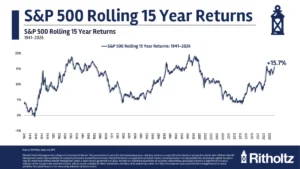
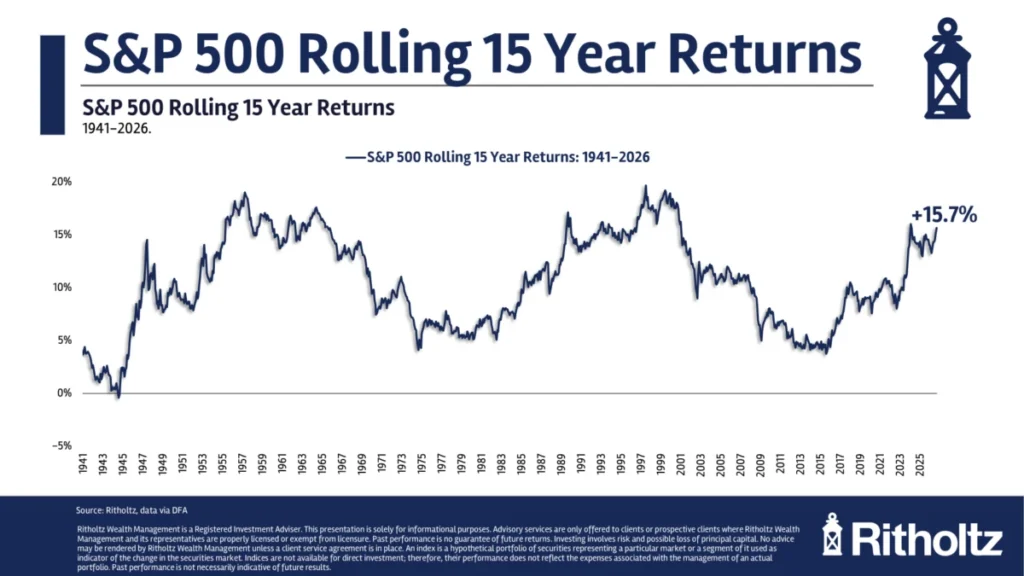
Historically, the S&P 500 has delivered a remarkably consistent long-term nominal average annual return of roughly 10% over the past century. However, looking at performance through various trailing time frames reveals a distinct divergence. While rolling 20-year to 50-year returns hug that historical 10% baseline closely, any window of 15 years or less showcases performance that is squarely, and in some cases dramatically, above average.
Basic financial mathematics dictates that periods of prolonged above-average returns must eventually be counterbalanced by periods of below-average returns to preserve the historical mean. Yet, as the post-2010 financial landscape has thoroughly demonstrated, mean reversion is an elusive phenomenon. Skeptics and valuation purists have been sounding the alarm bells over "stretched valuations" since the mid-2010s, only to watch the market continue its upward trajectory, supercharged by sweeping technological innovations like the artificial intelligence (AI) boom.
While the ultimate trajectory of the current bull market remains unknown, a deep dive into historical precedents—particularly the frantic late-1990s dot-com bubble and the structural realities of secular market cycles—offers vital lessons for modern investors navigating an era of heightened market optimism.
Chronology: A Century of Structural Market Waves
To understand where the stock market stands today, it is essential to trace the historical evolution of secular market cycles over the past 100 years. Stock market returns do not typically move in a straight line; instead, they operate in massive, multi-year waves characterized by distinct alternating regimes of secular bull and bear markets.
- The Post-WWII Era to the 1970s Stagnation: Following the Second World War, the United States entered a prolonged period of economic expansion that fueled substantial equity gains. However, this eventually gave way to the stagflationary environment of the 1970s, which flattened real returns and tested investor resolve.
- The 1982–1999 Secular Bull Market: One of the most powerful bull runs in modern financial history began in the early 1980s and culminated in the late 1990s. The final stretch of this cycle—spanning from 1995 to 1999—featured explosive, speculative gains driven by the dawn of the internet and telecommunications revolution. During this five-year window, the S&P 500 posted breathtaking consecutive annual returns that left traditional valuation metrics in the dust.
- The Lost Decade (2000–2012): True to the principle of mean reversion, the bursting of the dot-com bubble, compounded by the 2008 Global Financial Crisis, ushered in a brutal secular bear market. For over a decade, investors experienced flat-to-negative real returns, proving that "lost decades" are a very real historical hazard.
- The Post-2019 Expansion and the AI Boom: Following the recovery from the Great Recession and a brief pandemic shock in 2020, the market embarked on another staggering run. Performance metrics since 2019 bear an uncanny, though not identical, resemblance to the late-1990s melt-up. Fueled heavily by mega-cap technology stocks and the generative AI revolution, this current cycle has pushed 15-year trailing returns well above historical norms.
Supporting Data and Comparative Analysis
When examining rolling 15-year annual returns over the last century, the cyclical nature of equities becomes undeniably clear. The market behaves much like an ocean wave, shifting steadily from prolonged eras of wealth creation to extended periods of consolidation and capital preservation.
Crucially, however, analysts must grapple with a stark limitation: the small sample size of secular cycles. Over the past century, financial historians are essentially analyzing a mere three gigantic secular bull markets (including the current iteration) paired with three bone-crushing secular bear markets. Because the dataset is so compact, drawing definitive blueprints from past decades carries inherent risks.
Consider a structural comparison between the late-90s mania and the post-2019 environment:
- The 1995–1999 Window: Capped off the tail-end of a two-decade-long bull market characterized by rampant speculation in early-stage internet companies, telecom infrastructure, and widespread retail participation via the proliferation of online brokerages.
- The Post-2019 Window: Developed in the wake of unprecedented monetary and fiscal stimulus, punctuated by remote-work technology adoption and a generational transition toward artificial intelligence hardware, cloud computing, and automated enterprise software.
While these two environments feature different underlying catalysts, the market psychology remains remarkably similar. In both cases, investors who tried to time the top based purely on elevated price-to-earnings (P/E) ratios found themselves severely penalized as the market continued to melt upward.
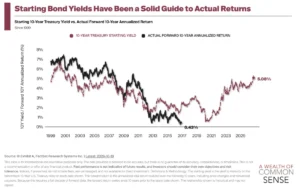
Furthermore, the data highlights a persistent forecasting failure across the professional investment community. For well over a decade, institutional strategists and wealth managers have consistently warned clients to expect lower-than-average forward returns due to high starting valuations. Yet, time and again, the opposite has occurred. The market has repeatedly smashed through conservative forecasts, rewarding those who stayed fully invested.
Official Responses and Expert Perspectives
The persistence of above-average returns in the face of lofty valuations has sparked intense discourse among economists, market historians, and behavioral finance experts.
The Structural Optimists:
Many contemporary market observers argue that structural shifts in the global economy justify higher valuations. Proponents of this view point out that today’s market is dominated by asset-light, highly profitable technology conglomerates with fortress balance sheets, vast global moats, and immense free cash flow generation. From this perspective, comparing 2026 valuations directly to 1999 or 1929 metrics is an "apples-to-oranges" error because modern tech giants possess a profit-generating capacity that historical industrial firms simply could not match.
The Valuation Realists & Risk Strategists:
Conversely, seasoned behavioral economists and risk-focused portfolio managers urge caution, reminding market participants that human psychology during late-cycle expansions rarely changes. As veteran financial writer and researcher Ben Carlson points out, “Eventually above-average returns lead to below-average returns because, well, math. But mean reversion can take longer than you think.”
Experts note that while the exact timing of mean reversion is impossible to predict—and could theoretically be delayed further if the AI boom mirrors the prolonged heights of post-WWII productivity expansions—ignoring the mathematical reality of cycles is a perilous gamble. Whether future cycles accelerate or become more uneven due to algorithmic trading and global interconnectivity, the underlying laws of supply, demand, and valuation cannot be permanently repealed.
Implications for Investors: Building a Margin of Safety
What does this complex interplay of historical cycles, mathematics, and market momentum mean for the everyday investor trying to secure their financial future?
The implications stretch far beyond academic debates over P/E ratios; they strike at the heart of sound financial planning and risk management.
1. The Danger of "Crying Wolf"
Investors who abandoned equities in the mid-2010s out of fear that the market was "overvalued" missed out on one of the greatest bull runs in history. This highlights a critical lesson: being early is indistinguishable from being wrong. Exiting the market prematurely based solely on valuation metrics can severely impair long-term wealth accumulation.
2. The Power of Lower Expectations
Paradoxically, even if the current bull market still has several productive years left to run, intentionally reining in your expectations for future returns is one of the smartest defensive moves a saver can make.
Adopting conservative return assumptions in your long-term financial plan provides a vital margin of safety:
- If bad things happen (e.g., a sharp economic contraction, unexpected inflation shocks, or a secular bear market materializes), your portfolio is stress-tested, and you are psychologically and financially prepared to weather the storm without panic-selling at the bottom.
- If good things continue to happen and the market delivers pleasant upside surprises, it acts as a welcome financial bonus rather than a baseline requirement for meeting your retirement goals.
Conclusion
Ultimately, the future path of the S&P 500 is unwritten. Whether the current cycle extends into a historic melt-up driven by artificial intelligence or rolls over into a period of mean-reversion, the prudent investor treats uncertainty not as a threat, but as a condition to be managed. By respecting the historical reality of market cycles while maintaining disciplined, conservative planning assumptions, investors can achieve a true win-win scenario: prepared for the worst, yet positioned to benefit if the good times keep rolling.