Market Review: S&P 500 Suffers Longest Losing Streak in Nearly Two Years
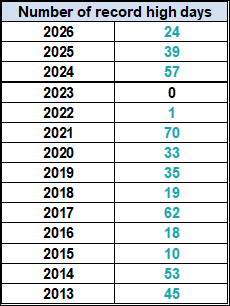
The U.S. equity markets faced a challenging week, as the S&P 500 endured a continuous daily decline that marked its longest losing streak since August 2025. This downward momentum resulted in a 2.0% loss for the index over the five-day trading period, breaking a three-week winning streak and forcing investors to reevaluate the stability of the current market cycle. As of the market close, the index remains 3.4% below the record high it achieved on June 2, 2026.
Chronology of the Decline
The week began with pervasive bearish sentiment, as selling pressure persisted through every session. For market participants, this consistent daily retreat was particularly jarring, as it marked the most sustained period of negative performance in nearly two years.
While individual daily losses were not catastrophic in isolation, the cumulative impact of five consecutive days in the red eroded investor confidence. This performance stands in sharp contrast to the buoyant conditions observed earlier in the quarter, where the S&P 500 frequently tested new highs. The index’s inability to find a floor during the week reflects a broader underlying anxiety regarding macroeconomic conditions and potential shifts in corporate earnings growth.
Contextualizing Market Performance: A Historical Perspective
To understand the current volatility, it is necessary to place today’s market climate into a broader historical context. The S&P 500’s journey since the Global Financial Crisis (GFC) of 2008 has been one of profound resilience, yet marked by distinct, painful cycles.

The Shadow of 2007-2009
The GFC serves as the ultimate benchmark for modern equity drawdowns. On October 9, 2007, the S&P 500 hit a peak of 1565.15 before embarking on a catastrophic 17-month slide. By March 9, 2009, the index had shed approximately 57% of its value, bottoming out at 676.53. It was not until March 28, 2013—more than five years later—that the market finally clawed its way back to a new all-time high of 1569.19.
When we analyze the drawdowns since 2007, the sheer depth of the 2008-2009 crash often obscures smaller, albeit significant, corrections in subsequent years. However, when the data is adjusted to exclude the GFC and begins from the 2009 trough, the narrative changes significantly. Recent selloffs, particularly those seen in 2022, appear more pronounced when viewed through this lens, highlighting that while the market has been historically bullish, it is not immune to bouts of intense, cyclical volatility.
Supporting Data: Moving Averages and Technical Indicators
Technical analysis provides a granular view of the current structural health of the S&P 500. As of the most recent data, the index has drifted below its 50-day moving average (as of June 26, 2026), a level often viewed by institutional traders as a key support threshold.
However, the index remains above its 200-day moving average—a trend that has been in place since April 8, 2026. Furthermore, the "Golden Cross" dynamic, where the 50-day moving average sits above the 200-day moving average, has persisted since July 1, 2025. While the recent slip below the 50-day line is a technical warning sign, the fact that the 200-day average remains intact suggests that the long-term bullish trend is not yet technically invalidated.

Volatility Trends
Volatility, as measured by the intraday price range, has become a defining characteristic of this period. The correlation between closing prices and intraday swings has intensified. Notably, April 9, 2025, remains a significant outlier in recent memory, with a 10.77% intraday volatility spike—the most severe movement since the 19.10% swing seen on December 24, 2018. The current 20-day moving average for intraday price movement sits at 1.30%, indicating a market that is currently experiencing heightened, though not necessarily extreme, sensitivity to daily news flows.
Comparative Analysis: Market Cap vs. Equal Weight
A compelling facet of the current market environment is the performance disparity between the standard market-cap-weighted S&P 500 and the S&P 500 Equal Weight Index.

The traditional S&P 500, dominated by large-cap technology and growth stocks, has posted a year-to-date return of 7.4%. In contrast, the S&P 500 Equal Weight Index—which grants each of the 500 constituents an identical influence on performance—has returned 11.0% year-to-date. This divergence suggests that the broader market is currently healthier than the top-heavy index implies. Investors are seeing more consistent performance from mid- and small-cap names within the index, which are currently outperforming the concentrated giants that usually drive market-cap-weighted results.
Implications for Investors
The current market retreat serves as a reminder of the inherent risks in equity investment. Financial advisors and analysts are urging clients to consider the following implications:

- The Risk of Concentration: The outperformance of the Equal Weight index relative to the standard S&P 500 serves as a warning for investors overly concentrated in a handful of mega-cap stocks. Diversification remains the primary defense against sector-specific volatility.
- Technical Discipline: The breach of the 50-day moving average suggests that short-term traders may need to tighten stop-losses. However, for long-term investors, the proximity to the 200-day moving average provides a crucial floor that, if breached, could signal a more significant shift in market sentiment.
- Volatility Management: With the 20-day average for intraday volatility at 1.30%, investors should be prepared for larger-than-average daily price swings. Implementing dollar-cost averaging strategies can help mitigate the psychological impact of these daily fluctuations.
Official and Industry Perspectives
While there has been no singular "official" response from regulatory bodies regarding this week’s decline, industry sentiment remains cautious. Portfolio managers are largely focusing on the upcoming earnings cycle to determine if the 3.4% gap from the June 2nd record high will be closed in the short term or if the market is entering a period of consolidation.
For those looking to gain exposure to the S&P 500, a variety of instruments remain at their disposal, each offering different ways to manage the current volatility. Popular ETFs such as the iShares Core S&P 500 ETF (IVV), the SPDR S&P 500 ETF Trust (SPY), and the Vanguard S&P 500 ETF (VOO) continue to serve as the standard vehicles for core holdings. Meanwhile, those seeking to capitalize on the performance of the broader constituent base may look toward the Invesco S&P 500 Equal Weight ETF (RSP), which, as data shows, has provided a more robust return profile throughout 2026.

Conclusion: Looking Ahead
The S&P 500 stands at a crossroads. While the longest losing streak in nearly two years has naturally invited skepticism, the long-term technical indicators—most notably the position of the 200-day moving average—suggest that the foundation of the market remains intact.
Investors must now look past the headlines of daily losses and focus on the fundamental health of the underlying companies. As we move into the latter half of the year, the interplay between interest rate expectations, corporate profitability, and broader macroeconomic stability will determine whether the recent 3.4% dip is a mere bump in the road or the beginning of a deeper correction. For now, market participants are advised to maintain a balanced perspective, acknowledging that volatility is the price of admission for long-term equity growth.